Gabor-Granger or Van Westendorp?
A pricing lead choosing between Gabor-Granger and Van Westendorp for an upcoming study is really choosing between two ways of asking a hypothetical question. Gabor-Granger asks respondents to say yes or no to a sequence of set prices; Van Westendorp asks them to name the price where a product feels too cheap, cheap, expensive, or too expensive. Neither one tests what a real price change would do to real demand, which is the actual decision at stake.
- Gabor-Granger and Van Westendorp are both stated-preference surveys: they ask about price in isolation, under hypothetical conditions, and return a self-reported number rather than a tested behavioral response.
- Gabor-Granger builds a demand curve from sequential purchase-intent questions and points to a revenue-maximizing price; Van Westendorp triangulates an acceptable price range and a quality floor from four open-ended questions.
- Standard practitioner advice treats them as complementary: Van Westendorp early, when the acceptable range is unknown, and Gabor-Granger later, once the range is known and a single price point is needed.
- Naming a failure mode here lets a buyer check it before they commission the study. Both carry documented distortions: stated purchase intent runs higher than real buying behavior, and Van Westendorp's line-crossing logic has been criticized for lacking a theoretical foundation and for lowballing the market.
- The decision that actually matters is whether to trade either stated-preference survey for a randomized pricing experiment that reports a causal effect with a confidence interval, not which four questions to ask.
What do Gabor-Granger and Van Westendorp actually measure?
Both measure stated intent, not behavior. Gabor-Granger shows respondents a sequence of set price points and asks a yes/no purchase-intent question at each one, building a demand curve and identifying the price that maximizes projected revenue. Van Westendorp asks four open-ended questions (too cheap, cheap, expensive, too expensive) and finds where the resulting curves cross to triangulate an acceptable price range and a "too cheap" quality floor. Both methods date to the 1960s and 70s, predate modern experimental design, and remain the two defaults taught by nearly every market research shop, including SurveyMonkey, Sawtooth Software, Drive Research, QuestionPro, and Conjointly, whose comparison guides describe the two methods in nearly identical terms.
When should you use each one, according to standard advice?
The standard advice is a decision tree, not a validation claim. Use Van Westendorp early in a product's life, when the acceptable price range is unknown, especially for new or unfamiliar offerings. Use Gabor-Granger once the range is roughly known and the question has narrowed to a specific revenue-optimizing price, especially for existing products or line extensions. Most guides recommend running both in sequence, then patching known weaknesses with Newton-Miller-Smith or Rayner interpolation extensions. That advice answers which questions to ask. It does not answer whether the answers mean what buyers actually do at those prices, and none of the major guides publish a benchmark checking their outputs against real purchase behavior.
Gabor-Granger vs. Van Westendorp, side by side
| Gabor-Granger | Van Westendorp | |
|---|---|---|
| What it asks | A sequence of yes/no purchase-intent questions at set price points | Four open-ended questions: too cheap, cheap, expensive, too expensive |
| What it outputs | A demand curve and a single revenue-maximizing price | An acceptable price range and a "too cheap" quality floor |
| Known failure mode | Hypothetical purchase intent runs higher than real buying behavior, a documented and directionally consistent effect with no published market-specific benchmark | Its line-crossing logic has been called theoretically ungrounded and prone to lowballing, and it does not natively predict purchase behavior, so practitioners bolt on Newton-Miller-Smith extensions ([Wikipedia](https://en.wikipedia.org/wiki/Van_Westendorp%27s_Price_Sensitivity_Meter); [Relevant Insights](https://www.relevantinsights.com/articles/van-westendorp-price-sensitivity-meter/); [Sawtooth Software](https://sawtoothsoftware.com/resources/blog/posts/van-westendorp-pricing-sensitivity-meter)) |
| Best for | An existing product or line extension where the plausible range is already known and one defensible price point is the goal | A new or unfamiliar product where the plausible price range itself is still unknown |
Why do both produce numbers you can't defend in a real pricing decision?
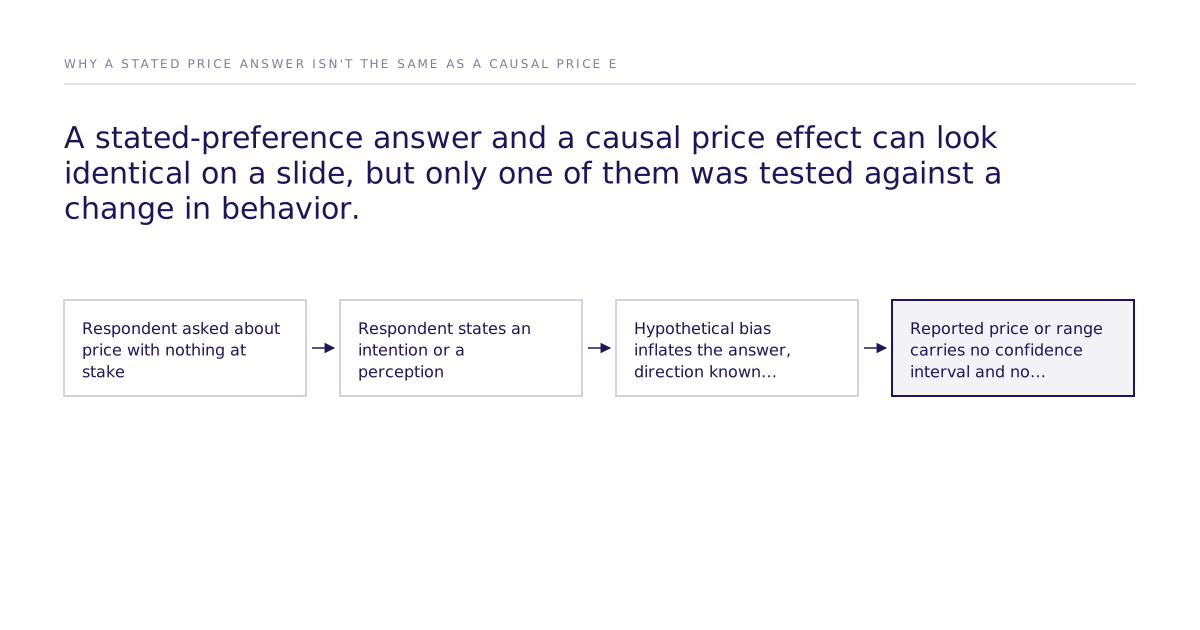
Both fail for the same underlying reason: they ask about price with nothing real at stake. Respondents answering a Gabor-Granger sequence or a Van Westendorp questionnaire are imagining a purchase, not making one, and stated purchase intent consistently runs higher than what people actually do once money changes hands. That gap has a name, hypothetical bias, and its direction is well established even where its exact size for a given market isn't. Van Westendorp compounds the problem by asking about price in isolation from competitors and product context, which the research community has criticized directly: the method's line-crossing logic "has been criticized and largely discredited for lacking a solid theoretical foundation and a track record of predictive success" (Wikipedia), and it tends toward "lowballing," producing optimal prices lower than what the market would actually bear (Relevant Insights). Even Sawtooth, which teaches the method, notes it doesn't natively predict purchase behavior, which is why practitioners patch it with Newton-Miller-Smith extensions rather than validating it against ground truth (Sawtooth Software). A patch on a stated-preference question is still a stated-preference question.
What does a causal alternative look like?
A causal alternative randomizes the price itself and measures the resulting change in choice, rather than asking about price directly. The causal claim comes from the randomization, not from the statistical model used to read it out: McFadden discrete choice, Mixed Logit, and ICLV are estimators for reading the results of a randomized experiment, not causal methods on their own. Where the analysis relies on a flat multinomial logit, preference-share and substitution estimates carry the independence-of-irrelevant-alternatives assumption, which can misstate how buyers switch between close substitutes; Mixed Logit and ICLV relax that assumption at the cost of added modeling complexity.
This is also where a real validation number matters, and where it's still bounded by real limits. Our best configuration reaches 87% of the measured human ceiling on one study: 0.832 rank correlation against the published human result, where two independent samples of real humans reach 0.959. Across all 43 studies that pass design filters the mean is 0.73. It is a validation result, not a guarantee for a new market, and current model-by-model figures are published on the leaderboard rather than left as a single quoted number (see the causal fidelity paper). Publishing this caveat is what lets a buyer weigh the figure instead of just quoting it. That figure also comes with an honest caveat: some published human studies could exist in a model's training data, and the replication protocol is built to screen for that contamination risk rather than pretend it doesn't exist. A confidence interval from a simulated experiment describes the effect within the simulated population tested; it doesn't bound the real market unconditionally, which is exactly why it's a starting estimate to validate against real behavior, not a final answer. More on how that validation works is in the methods and validation series.
So which one should you run?
Neither, as your primary source of a price. If you're this far into comparing Gabor-Granger and Van Westendorp, you already have a rough price range and a specific decision in front of you: what happens to demand if price moves. That's a question about behavior under a change, which is what a randomized experiment is built to answer, not what an isolated, hypothetical survey question was ever designed to answer. This sits alongside the rest of our comparisons coverage of legacy stated-preference methods.
Before commissioning either study, run one gap-check on data you already have: take a past Gabor-Granger or Van Westendorp result and compare it against actual conversion or renewal behavior at the prices you tested. If the stated number and the behavioral number diverge by more than a few points, that's hypothetical bias showing up in your own numbers, and it's the reason to test the next price change as an experiment instead of a question. If you want to see how a randomized pricing experiment is set up before running one, get in touch.