UX Testing vs Market Research for Evaluating Software
A VP of Product deciding whether a redesign ships next sprint needs a method for evaluating the software, not just a preference between UX testing and market research. UX testing shows whether five to twenty users can complete a task; market research shows what a sample says it wants or would pay, and neither randomizes the variable in question. So neither answers the question the ship decision depends on: which design, price, or message changes behavior, with a confidence interval attached.
- UX testing (UserTesting, Maze, Lyssna) measures whether a small group of users can complete a task; it does not test whether a specific design decision changes behavior at scale.
- Market research (Qualtrics, SurveyMonkey) measures stated preference through surveys; stated intent consistently diverges from actual purchase behavior.
- Neither method randomizes the variable under debate, so neither can claim the design, price, or message caused the outcome observed.
- A randomized experiment run on a simulated market and checked against real human behavior isolates that one variable and reports a confidence interval around its effect.
- The right choice depends on the question: diagnosing an existing interface calls for usability testing; deciding between options that don't exist yet calls for a randomized experiment.
UX testing and market research answer different questions, but neither proves causation
UX research is built to answer "does this work and is it intuitive," using qualitative methods: personas, journey maps, moderated usability sessions. Market research is built to answer "will people want this and pay for it," using quantitative surveys, segmentation, and purchase-intent questions. The two disciplines have split into separate tool categories and separate vendor camps. UX Studio's own comparison of the two describes them as typically run as distinct workstreams across the product lifecycle rather than as one integrated method (uxstudioteam.com).
Most guidance tells the buyer to run both anyway: usability testing to catch friction, market research to validate demand. Running both doesn't close the underlying gap, because both traditions report what a small, self-selected sample said or did in one uncontrolled setting. Neither isolates the effect of the one variable the buyer controls, on behavior, with a number attached to how confident to be in that estimate. CB Insights' analysis of failed venture-backed companies found poor product-market fit was the leading cause of failure, cited in roughly 42-43% of cases (cbinsights.com). The stat doesn't prove descriptive research caused those failures; it's a correlation, not a test of what would have moved the market before the money was spent. That test is exactly what UX testing and market research aren't built to run.
Does the five-user usability rule still hold?
Only at the discovery rate it assumes, and that rate is often optimistic. Jakob Nielsen and Thomas Landauer's 1993 model holds that five users surface about 85% of usability problems, built on an average 31% per-session problem-discovery rate (measuringu.com).
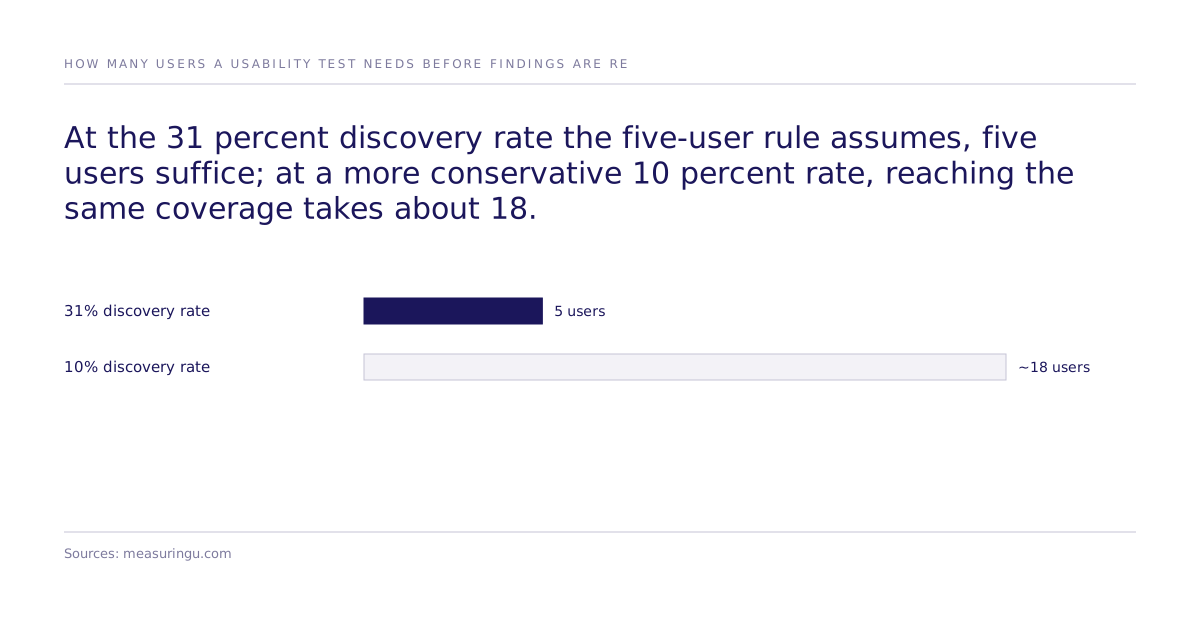
At lower discovery rates, the math changes fast: reaching the same 85% coverage at a 10% discovery rate takes about 18 participants, not five (measuringu.com). A buyer treating "we ran five usability sessions" as a decision gate is relying on an assumption about their own study's discovery rate that nobody checked.
Why do stated-preference surveys mislead on purchase intent?
Because what people say they'd buy and what they actually buy diverge, and the gap is measurable. A study by DecTech with Warwick University's Behavioural Science Group, using 52 weeks of actual sales data across 600 stores, found revealed-preference methods predicted real-world purchase outcomes 1.5 times more accurately than the best-performing stated-preference survey method (dectech.co.uk). That result comes from one retail category, 600 stores, and one 52-week window; it's evidence that the say-do gap is real and measurable, not a general law about every survey. The gap itself is structural to the survey format: a respondent answering a purchase-intent question pays no cost for being wrong, so the answer reflects self-image and social desirability as much as actual demand. Any willingness-to-pay figure taken from an unincentivized stated-preference survey carries hypothetical bias: stated WTP runs directionally high, not as a price to plan around.
UX testing vs market research vs a randomized experiment
| UX testing (UserTesting, Maze, Lyssna) | Market research (Qualtrics, SurveyMonkey) | Randomized experiment on a simulated market | |
|---|---|---|---|
| What it measures | Whether a small group can complete a task, and where it gets stuck | What a sample says it wants, prefers, or would pay | The effect of one specific intervention (design, price, message) on choice |
| Sample and method | Roughly 5-20 users, think-aloud, task completion | Survey respondents, self-reported intent | Randomized manipulation, analyzed with discrete choice models (McFadden DCE, Mixed Logit, ICLV) |
| Core weakness | Coverage assumption breaks down below the 31% discovery rate it was built on | Stated intent diverges from revealed behavior (say-do gap) | A simulated result checked against a human baseline, not a guarantee for a new market |
| Best for: | Catching interface friction before launch | Sizing markets and segments broadly | Proving which specific intervention moves behavior, with a confidence interval |
What a randomized experiment on a simulated market proves
A randomized experiment answers a narrower, harder question than either UX testing or market research: which specific intervention, this design against that one, this price against that one, this message against that one, changes choice, and by how much, within a stated confidence interval. The causal identification comes from the randomized manipulation built into the experiment design, not from the statistical method used to analyze results afterward. Naming a method correctly is what lets a buyer check the claim behind it, so the terminology gets corrected here rather than left loose: McFadden discrete choice, Mixed Logit, and ICLV are estimators that turn choice data into effect sizes; they are not causal methods on their own, and the more accurate description of the work is randomized experiments analyzed with discrete choice models. When a flat logit model is used to estimate preference share or substitution patterns, it carries the independence of irrelevant alternatives (IIA) assumption; Mixed Logit relaxes that assumption when substitution patterns are expected to vary.
Subconscious runs these randomized experiments against a simulated population and checks the result against real human studies. A performance number by itself is marketing copy. The study it was measured against, and what it does not cover, is what turns it into evidence a buyer can check. Our best configuration reaches 87% of the measured human ceiling on one study: 0.832 rank correlation against the published human result, where two independent samples of real humans reach 0.959. Across all 43 studies that pass design filters the mean is 0.73. It is a validation result, not a guarantee for a new market. Details are in the causal fidelity paper. Results by method and study are published on the leaderboard, so a buyer can check accuracy by method rather than take the headline number on faith.
Where this method still has limits
Three caveats worth holding onto. First, published human studies can sit inside a model's training data, which would artificially inflate replication accuracy if not controlled for; the replication protocol is built to check for this, but the risk doesn't disappear just because a number exists (see the causal fidelity paper). Second, a confidence interval from a simulated experiment covers the effect within the simulated population that was tested, not the real market unconditionally; it's evidence to weigh, not a bound to cite unconditionally. Third, 87% of the measured human ceiling (0.832 against a 0.959 human-to-human ceiling; mean 0.73 across the 43 studies passing design filters) is a validation-set result. A new market, a new category, or an unusual audience can fall outside that validation set, and the honest move for any specific new question is to check the leaderboard and the method used for a comparable study, not to assume the headline number transfers.
Which method should the senior buyer choose?
It depends on whether you're diagnosing an existing interface or deciding between options that don't exist yet. If the product is built and the question is "where do people get stuck," a moderated usability session still does that job well and fast, as long as it's sized for the discovery rate observed, not the assumed 31%. If the question is "which of these designs, prices, or messages will change behavior, and how confident should I be," neither a usability session nor a purchase-intent survey answers it, because neither randomizes the variable in question. That's a randomized experiment, run against a large enough simulated population to produce a confidence interval, then checked against a human baseline before the buyer trusts it.
Name the one variable in play for the decision in front of you: this design versus that one, this price versus that one, this message versus that one. Check whether the study about to run randomizes it. If it does, it's a causal experiment, whatever tool built it. If it doesn't, it's a description of a sample, and the decision still has to be made on top of that description. Compare methods and studies on the leaderboard before choosing one, or talk to the team about how the randomized-experiment method applies to your specific decision.