Finally, a Brand Tracker with humble price tag
---
A senior brand or insights lead evaluating brand trackers this quarter is not really choosing a price tier. They are choosing whether, six months from now, anyone on the team can say why a metric moved. A subscription tracker like Tracksuit or Latana costs a fraction of what Kantar, Ipsos, or Nielsen charge, but it runs the same underlying survey instrument those enterprise programs run, so it inherits the same blind spot: it can show that awareness moved, not why it moved. A humble price tag lowers the invoice. It does not buy attribution.
- Enterprise brand trackers from Kantar, Ipsos, and Nielsen run $100K to $500K+ a year for multi-market programs; survey-based trackers more broadly run $25K to $150K a year (userintuition.ai).
- Subscription challengers like Tracksuit ($99 to $299/month) and Latana ($1,000 to $3,000/month) cut the price by 10x to 100x, but the measurement underneath is still a repeated cross-sectional survey, not an experiment.
- A cheaper subscription buys the same measurement uncertainty more frequently. It does not tell you whether a metric move came from your campaign, a competitor's stumble, seasonality, or sampling noise.
- Attributing a metric move to a specific decision, such as a price change or a new message, requires a randomized experiment analyzed with discrete choice models, not a cheaper wave of the same instrument.
How much does a brand tracker cost in 2026, and why is the price dropping?
Enterprise programs from Kantar, Ipsos, and Nielsen have historically run $100K to $500K or more per year for quarterly or monthly multi-market waves, with survey-based trackers more broadly landing in the $25K to $150K range (userintuition.ai). That pricing put continuous brand health measurement out of reach for most mid-market teams, who could afford a wave once or twice a year at best.
Since 2023, a wave of subscription trackers has repackaged the same core metrics, awareness, consideration, NPS, brand associations, into always-on dashboards at a fraction of the cost. Tracksuit prices its Essential, Advanced, and Pro tiers at $99, $199, and $299 per month (userintuition.ai), pitched explicitly as a fraction of the $1M+ a year enterprise brands have typically spent (Tracksuit). Latana sits between the two tiers, at $1,000 to $3,000 a month for enterprise configurations, with mid-tier annual contracts reported in the $20K to $50K range (g2.com).
The buyer's procurement choice now looks real: a six-figure agency program, or a four-figure SaaS subscription promising comparable metrics at higher frequency.
Is a cheaper brand tracker measuring something different than an expensive one?
No. Both run the same repeated cross-sectional survey: ask a sample of respondents what they think or would do, plot the answers over time. Cutting the price from $500K a year to $299 a month changes the cadence and the invoice, not the instrument. A move in the resulting line, whether it comes from a $500K Kantar wave or a $99 Tracksuit dashboard, is still an uncontrolled correlation. Nobody ran an experiment; nobody controlled for what else changed that quarter.
That matters because stated preference reliably diverges from actual behavior, a gap researchers call the say-do gap: what a respondent says they would do on a survey is not what they do when a real price or a real switching cost is on the table. If the underlying survey question already carries that kind of bias, running it more often at a lower price does not fix it. It just produces the same uncertainty on a tighter loop.
What actually explains a metric move?
Usually more than one thing, which is exactly why a single tracked line cannot answer the question on its own. A brand awareness score can move because of a campaign, a competitor's product recall, a seasonal pattern, or plain sampling noise in that wave's respondent panel, and a repeated survey has no mechanism to tell those apart. It reports the number. It does not report the cause.
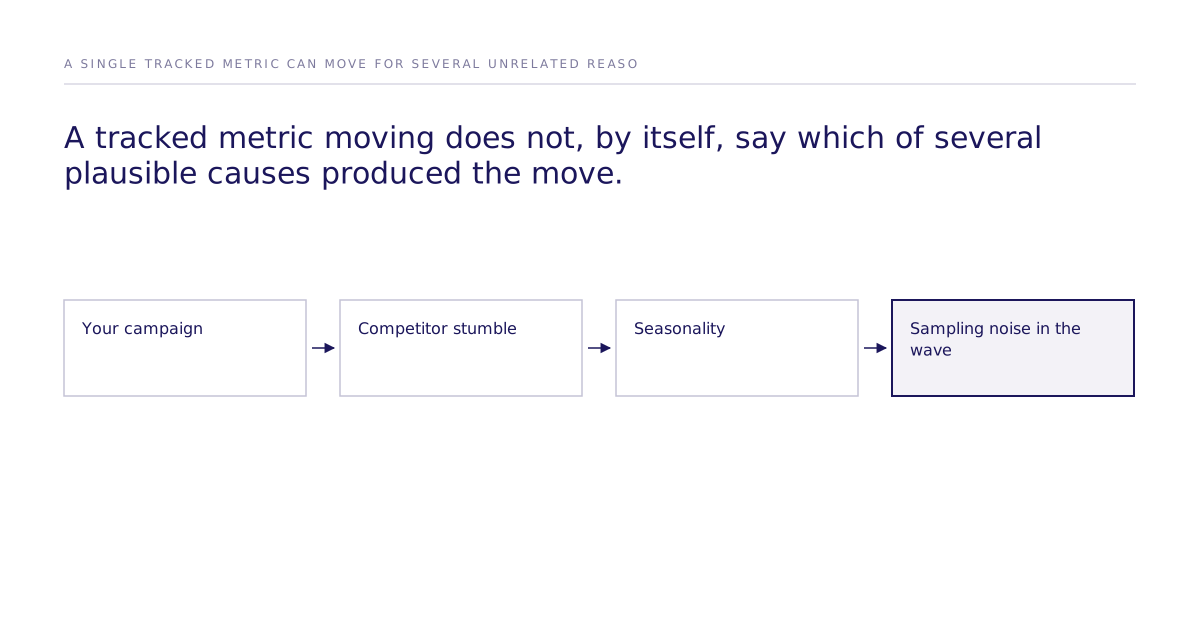
Answering "what moved it" requires isolating one variable and holding the rest constant, which is what a randomized experiment does and a tracking wave does not.
What would it take to attribute a metric move to a cause?
A randomized experiment on the decision itself, analyzed with a discrete choice model, rather than another wave of the same observational survey. In a randomized experiment, respondents (or a simulated population standing in for them) are exposed to controlled variations, say, two price points, two messages, two feature bundles, and their choices are estimated using methods like McFadden discrete choice, Mixed Logit, and ICLV. Naming this distinction is what lets a buyer check the method. These are estimators, not causal methods in themselves; the causal identification comes from the randomized manipulation in the experiment design, not from the estimator. Mixed Logit is worth naming specifically because it relaxes the independence-from-irrelevant-alternatives assumption a flat logit model carries, which matters whenever the real question is which competitor a switched customer would move to next.
That structure is what lets a team say a metric moved because of the price change, not merely that it moved. Our best configuration reaches 87% of the measured human ceiling on one study: 0.832 rank correlation against the published human result, where two independent samples of real humans reach 0.959. Across all 43 studies that pass design filters the mean is 0.73. See the causal fidelity paper. That number is a validation-set result, not a guarantee for a new, unseen market, and it comes with a real limitation worth stating plainly: some of the published studies used for validation could have been present in a model's training data, which is exactly why the replication protocol exists, rather than a claim that the problem doesn't exist. The leaderboard tracks this in public rather than as a vendor claim. The misses sit on the public leaderboard next to the hits, so this interval's scope is stated directly. A confidence interval produced by one of these experiments covers the estimated effect within the simulated population that was run. It does not bound the real market unconditionally. For a deeper look at how the discrete choice methods work, see the methods and validation hub.
Enterprise agency, subscription dashboard, or randomized experiment
| Enterprise agency tracker (Kantar, Ipsos, Nielsen) | Subscription dashboard (Tracksuit, Latana) | Randomized experiment | |
|---|---|---|---|
| Price | $100K–$500K+/year ([userintuition.ai](https://www.userintuition.ai/posts/brand-tracking-cost/)) | $99–$299/month (Tracksuit); $1,000–$3,000/month (Latana) ([g2.com](https://www.g2.com/products/latana-brand-analytics/pricing)) | Scoped per experiment; no flat subscription price published |
| Cadence | Quarterly or monthly waves | Continuous, always-on | Per decision, on demand |
| Underlying instrument | Repeated cross-sectional survey | Repeated cross-sectional survey | Randomized experiment analyzed with discrete choice models |
| Tells you a metric moved | Yes | Yes | Yes |
| Tells you why it moved | No | No | Yes, with a confidence interval covering the simulated population |
| Public validation record | Rarely published | Rarely published | Public [leaderboard](/leaderboard), 87% of the measured human ceiling (0.832 against a 0.959 human-to-human ceiling; mean 0.73 across the 43 studies passing design filters) |
| Best for: | Global multi-market programs where syndicated category comparability already exists and budget is not the constraint. | Teams that need an always-on dashboard for stakeholder reporting and don't need to attribute a specific move to a specific decision. | A team facing a specific decision, like a price change or a message test, that needs to know which action drove the outcome before spending against it. |
The real cost of a humble price tag
The subscription price is the visible line item. The real cost sits one step downstream: the decisions a team makes on a metric move nobody can attribute to a cause. Take a team that sees consideration dip after a rebrand. They reverse the rebrand. The actual driver was a competitor's promotion that quarter. That team just spent real budget acting on noise a $299 dashboard reported with total confidence. A lower price tag doesn't change who pays for that mistake. It just makes the wrong call cheaper to generate and easier to justify, since "the dashboard moved" reads as evidence even when it isn't.
That is the actual comparison a senior buyer should be running, not agency price against subscription price, but subscription price against the cost of a decision made on an unattributed move. For a walk-through of how this plays out in practice, see the comparisons hub.
Next step: before the next renewal decision, take the last three metric moves your current tracker reported and try to write down, for each, the specific decision or event that caused it, without guessing. If none of the three can be attributed with any confidence, that is the answer to whether the tracker's price tag was ever the real cost. When you want to test a specific decision, like a price change, a message, or a feature bundle, against a randomized experiment instead of another wave, the team at /meet can walk through what that would look like for your market.