AustralianSuper leads the superannuation market in early 2026
A superannuation fund's chief marketing officer or head of product deciding whether to match AustralianSuper's 2026 brand spend needs to know one thing first: does any of this data prove members actually prefer AustralianSuper, or does it just prove most of them were never asked? As of April 2026, AustralianSuper tops every stage of the funnel Super Review tracks, with 58% unprompted brand awareness, 30% of members considering it, and 19% naming it their primary fund, while Australian Retirement Trust (the merged QSuper and Sunsuper fund) closes the conversion gap behind it (Super Review). A number without its limits is marketing copy. Publishing the limit next to it is what lets a buyer check the claim. None of those three numbers, alone or together, show that a specific attribute like fees, disclosed returns, or service quality is what causes a member to name AustralianSuper over the alternative of simply staying where an employer put them.
- AustralianSuper leads by scale and leads every funnel stage tracked by Super Review in April 2026, with ART closing the gap behind it.
- Every headline metric behind that lead (awareness, consideration, a fifth straight Roy Morgan trust award) is a stated-preference survey response, not a measured behavioral effect.
- Market-wide switching intent fell in 2025 even as NPS improved, which is consistent with inertia, not with active preference forming.
- Consolidation is shrinking the field fast: the top 24 funds hold about 96% of industry assets, and APRA's own performance test measures backward-looking benchmark performance, not why members choose a fund.
- A fund cannot tell whether it is winning on merit or on default status until it runs a controlled experiment that removes the default and observes what members choose instead.
What does market leadership look like for AustralianSuper in early 2026?
Market leadership right now means scale, incumbency, and top-of-funnel recognition, not a demonstrated causal edge in what members would choose freely. AustralianSuper enters 2026 as Australia's largest superannuation fund by scale. It has now won Roy Morgan's "Most Trusted Superannuation Brand" award for a fifth consecutive year (Roy Morgan), and per Super Review's April 2026 funnel tracking, it outranks every competitor at every stage measured, from unprompted awareness through primary-fund status (Super Review). By every conventional trade-press metric, this is a fund that has won. What those metrics cannot separate is how much of that win comes from members actively choosing AustralianSuper versus members simply never leaving the fund their employer defaulted them into.
Does AustralianSuper's funnel lead prove members prefer it?
Naming a metric's failure mode is what lets a buyer check it before spending against it. No. A funnel lead built on awareness, consideration, and trust scores is a correlation between brand recognition and default-driven inertia, not proof that any specific fund attribute causes members to choose it. Superannuation in Australia is a category where most members are enrolled by an employer's default fund arrangement rather than by comparing options and switching. Investment Trends' 2025 survey of more than 8,000 members found switching intentions declined even as market-level NPS improved from -19% to -4% (Investment Trends). If members are switching less while rating the category more favorably, that pattern is at least as consistent with rising comfort in staying put as it is with rising conviction about any one fund. "Market leader" in this data is a description of who holds the most defaults and the most name recognition. It is not evidence of what members would pick if the default were removed and they had to choose.
AustralianSuper vs Australian Retirement Trust: what the funnel shows and what it doesn't
| Chase funnel parity (awareness, consideration, trust score) | Run a randomized experiment on what drives member choice | |
|---|---|---|
| What it measures | Stated recall and self-reported consideration ([Super Review](https://www.superreview.com.au/australiansuper-extends-brand-dominance-as-art-boosts-conversion/); [Investment Trends](https://investmenttrends.com/resource/super-fund-member-engagement-report/)) | Which attribute (fee level, disclosed return, employer default arrangement, engagement touchpoint) changes a simulated member's choice, with default status held constant across arms |
| What it proves | That a name is recognized and trusted; not why anyone named it as their fund | A causal effect with a confidence interval, checked against a human baseline before it's trusted |
| Confound risk | High: near-record-low switching intent ([Investment Trends](https://investmenttrends.com/resource/super-fund-member-engagement-report/)) means most "primary fund" answers reflect default status, not comparison | Addressed by design: removing the default lets you isolate the attribute doing the work |
| Best for: | A fund with brand budget to spend and no near-term plan to test a specific product or pricing lever | A fund preparing a fee, disclosure, or engagement change and needing to know which lever actually moves member choice |
Why one funnel number hides two different causal stories
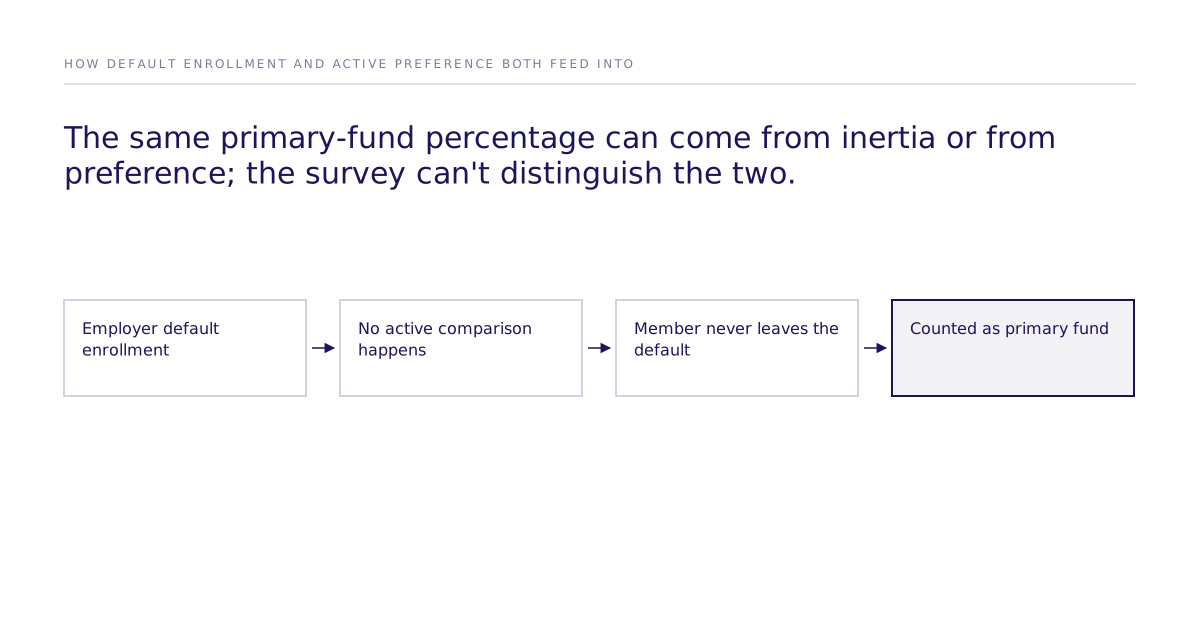
A single "primary fund" percentage can be produced by two entirely different processes, and the survey has no way to tell them apart. One member never compares funds at all; the employer's default enrolls them, and they are counted as a primary-fund holder without ever making an active choice. Another member compares fees, returns, and service, actively decides, and ends up counted the exact same way. Both land in the same 19% figure. That is the difficulty a funnel number cannot resolve on its own, and it's why AustralianSuper's funnel lead can be entirely real as a measurement while telling a buyer almost nothing about which of the two processes is driving it.
What is APRA's Your Future, Your Super test actually measuring?
A regulator's test is only useful to a buyer once its blind spot is stated plainly. It measures backward-looking, risk-agnostic investment performance against a benchmark, not whether members prefer or benefit from a fund's specific attributes. Passing means a fund's returns cleared a bar over the measurement period; it says nothing about fees relative to service, disclosure quality, or engagement design, and nothing about whether trustees are optimizing for member outcomes versus optimizing for the pass/fail line itself. If the regulator's own accountability tool can't isolate what drives good outcomes for members, a brand funnel survey built on recall and self-report certainly can't either. That gap is exactly where causal experimentation is supposed to sit, and right now nothing in the public record fills it.
Why did switching intent fall as trust scores rose?
Most likely because a market with fewer real alternatives and stronger defaults gives members less reason to compare, not because they've concluded any one fund is causally superior. APRA-regulated fund count fell from 107 to 89 in FY23-24, and the top 24 funds, each over $20 billion, now hold roughly 96% of industry assets, with nine funds exceeding $100 billion each (Investor Daily). As the field consolidates, the practical cost of comparison shopping rises and the number of genuinely different options falls. Rising trust and falling switching intent in that environment (Investment Trends) is exactly what a say-do gap looks like: what members report feeling and what they'd actually do if forced to choose can move in different directions, and a stated-preference survey has no way to catch the difference.
What would a causal test of fund preference look like?
It would put a representative sample of members through a randomized experiment where fund attributes, including default status itself, are manipulated one at a time, then analyze the choices with discrete choice models such as McFadden's discrete choice model, Mixed Logit, and ICLV. Mixed Logit in particular lets you model substitution across funds without imposing the independence-of-irrelevant-alternatives assumption, the requirement in a flat logit model that the ratio of choice probabilities between any two funds stays the same regardless of what other funds are in the choice set, an assumption a consolidating market with one dominant scale leader is likely to violate. Run correctly, that design produces a confidence interval around each attribute's effect, one that describes the simulated population under test and doesn't stand in as a claim about the entire live market.
The misses sit on the public leaderboard next to the hits, which is what makes the number checkable. Subconscious's best configuration reaches 87% of the measured human ceiling on one study: 0.832 rank correlation against the published human result, where two independent samples of real humans reach 0.959. Across all 43 studies that pass design filters the mean is 0.73, per the causal fidelity paper. It is a validation result, not a guarantee for a market that hasn't been tested yet. Published studies can sit in a model's training data, so the protocol is built specifically to check for that contamination rather than assume it away. The leaderboard publishes those replication results study by study, and the methods and validation hub covers how the estimators and the experimental designs fit together.
The next move for a fund's product or marketing lead
Before committing budget to chase AustralianSuper's funnel numbers, check whether a comparable study already exists on the leaderboard; if it doesn't, the next real step is designing a randomized experiment that holds default status constant and tests the specific attribute (fee structure, disclosed return, engagement touchpoint) you're actually deciding on. That tells you which lever moves member choice, not just which fund gets recognized. If you want help scoping that design for your own member base, the team can walk through it.