Calculation of volume, revenue, and profit in simulations
A pricing lead reviewing a conjoint or discrete choice simulator needs one answer before signing off on a forecast built from it. Does the volume, revenue, and profit number reflect a causal effect, or a survey artifact scaled up by arithmetic? Every commercial simulator, from Sawtooth Lighthouse Studio to Displayr to Qualtrics-based tools, computes these three figures the same way: multiply an estimated preference share by assumed market size for volume, multiply volume by price for revenue, and subtract cost structure for profit. That chain is a straight line of multiplication running from a single input, and it has been the industry's structure for over 20 years without a fundamental change (Greenbook).
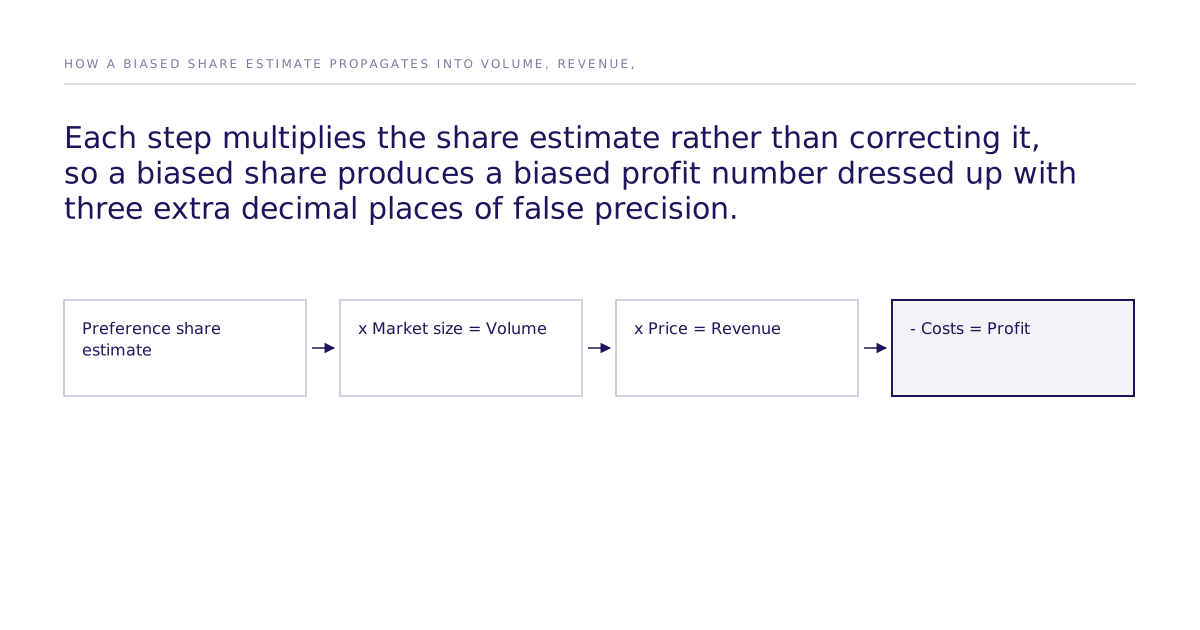
- Volume equals estimated share times assumed market size, revenue equals volume times price, and profit equals volume times price times (1 minus variable cost) minus fixed cost. That formula's structure hasn't changed in two decades.
- Because volume, revenue, and profit are all linear multiples of the share estimate, any bias in that share number is preserved, not corrected, as it moves through the calculation.
- Sawtooth's Randomized First Choice, which injects simulated error into partworths before computing shares, outperformed flat share-of-preference and first-choice rules on holdout prediction when it was introduced, though it still fits a correlational choice model rather than a randomized one (Orme 1998; Huber, Orme & Miller 1999).
- A number without its limits is marketing, so this gain publishes its scope alongside it. A 2025 nonparametric mixed logit study lifted out-of-sample share accuracy from 65.30 percent to 81.78 percent against classic BLP inversion in that one study, a published result, not a guarantee across categories (ScienceDirect).
- The fix isn't a better share formula. It's confirming the share number reflects a randomized, causally identified effect rather than a survey artifact, with a disclosed replication rate and its limitations stated alongside it.
How do conjoint and DCE simulators calculate volume, revenue, and profit?
They calculate all three as multiples of one number: the estimated preference share. A share rule, first choice, share of preference, or Randomized First Choice, produces a share for each product in the simulation. Volume comes from multiplying that share by an assumed market size. Revenue comes from multiplying volume by price. Profit comes from multiplying volume by price and by a margin assumption, then subtracting fixed costs. Sawtooth's Randomized First Choice, proposed by Orme (1998) and refined by Huber, Orme & Miller (1999), improves on this by adding simulated error to partworth utilities before the share calculation runs, and it has outperformed other Sawtooth share rules on holdout prediction, at a higher compute cost (Sawtooth Software). Greenbook's own practitioner guidance concedes there's no single right set of assumptions for turning a share into a volume number, which is a tell: the hard part isn't the multiplier, it's the number being multiplied.
Why does the share estimate decide the entire forecast?
Because every number downstream of it is a linear function of it, with no correction step built in. A 5 percent overstatement in share doesn't stay a 5 percent error in profit, it compounds through market size, price, and margin assumptions until it reads as a specific dollar figure with three decimal places of apparent precision. That precision is manufactured, not earned. The arithmetic is exact; the input feeding it may not be.
Does a better share-rule estimator fix the problem?
Naming this failure mode is what lets a buyer check the estimator before trusting it. Partially, and only for the part of the problem that estimation can fix. First choice and share-of-preference rules are flat logit models, which carry the IIA assumption, independence of irrelevant alternatives, and that assumption can distort predicted substitution when two products in the simulation are close competitors. Randomized First Choice relaxes this somewhat by injecting error before computing shares. A 2025 nonparametric mixed logit approach goes further, lifting out-of-sample share prediction accuracy from 65.30 percent to 81.78 percent against a classic BLP share-inversion model in that study (ScienceDirect). But McFadden discrete choice, Mixed Logit, and ICLV are estimators, not causal methods. They describe how a model fits observed choice data. Causal identification comes from whether the underlying experiment randomized the manipulation being tested, not from which estimator processes the results afterward. A more accurate estimator applied to a correlational survey still answers a correlational question more precisely.
What is hypothetical bias and why does it inflate the share number before any multiplication happens?
Hypothetical bias is the documented tendency for people to state preferences in a survey that don't match what they do when real money and real tradeoffs are on the table, and the direction runs one way: stated willingness to pay comes in higher than revealed willingness to pay. That means a share estimate built on unmitigated stated-preference data is inflated before a single volume or revenue calculation touches it. Practitioners already act on this instinct without naming it directly. Greenbook's own field guidance describes shops that apply an informal discount, some simply cutting any predicted share increase in half, as a hedge against overstated conjoint-derived forecasts (Greenbook). Halving a number by convention isn't a correction, it's an admission that the number wasn't trusted at face value.
Which share-estimation approach should a buyer trust for a real business case?
| Approach | How share is estimated | Known limitation | Fit |
|---|---|---|---|
| First choice / share of preference | Flat logit, no simulated error | Carries the IIA assumption; substitution can distort when alternatives are similar | Best for: quick, low-stakes internal screens where a directional read is enough |
| Randomized First Choice (Sawtooth) | Simulated error injected into partworths before shares are computed (Orme 1998; Huber, Orme & Miller 1999) | Outperformed flat logit rules on holdout prediction when introduced, but still fits a correlational choice model, not a randomized one | Best for: teams already inside Sawtooth's ecosystem who need a share-rule upgrade without changing survey design |
| Nonparametric mixed logit | Market-level parameters estimated without a fixed parametric mixing distribution | Lifted out-of-sample accuracy from 65.30 percent to 81.78 percent versus classic BLP inversion in one 2025 study; a published result, not a guarantee in a new category | Best for: econometrics teams who can implement custom estimation and want current best-in-class estimator accuracy |
| Randomized experiments analyzed with discrete choice models (McFadden, Mixed Logit, ICLV) | The manipulation is randomized in the experiment design itself; the discrete choice model estimates the effect but doesn't create the causal identification | Estimator quality still matters, and randomization doesn't by itself eliminate hypothetical bias in a stated-preference survey | Best for: buyers who need a volume or profit number to survive scrutiny on why an effect is real, not just how well it fits historical shares |
What does a causally identified share estimate actually require?
It requires the manipulation tested in the experiment to be randomized, not just the choice data fit with a sophisticated estimator afterward. Randomizing which price, feature, or message a synthetic respondent sees is what supports a claim that the resulting share difference is caused by that attribute rather than correlated with it. One public reference point for how this checks out against real behavior: our best configuration reaches 87% of the measured human ceiling on one study, 0.832 rank correlation against the published human result, where two independent samples of real humans reach 0.959. Across all 43 studies that pass design filters the mean is 0.73, reported in the causal fidelity paper. The leaderboard puts misses next to hits, and this is one of the misses on the record. That's a validation result on one study, not a guarantee for a new, untested market, and published human studies can sit inside a model's training data, a limitation the replication protocol is built to account for, not one that disappears because a protocol exists. A confidence interval computed from a simulated experiment describes the effect within that simulated population. It doesn't bound the real market's response unconditionally. The leaderboard publishes this kind of validation result openly rather than as a private claim, which is the standard a buyer should ask any vendor, including this one, to meet.
What should a buyer check before trusting a simulator's profit number?
Check whether the share estimate feeding the calculation came from a randomized manipulation or from a purely observational conjoint fit, before checking the market size assumption or the margin math. Ask which share rule was used and whether it's a flat logit subject to the IIA assumption. Ask whether the willingness-to-pay component was incentive-aligned or subject to unmitigated hypothetical bias, and in which direction that bias runs. Ask for a replication rate against real human behavior, with its limitations stated, not implied to be absolute. The methods and validation hub covers how these checks apply across different simulation methods in more depth. A profit projection that can answer all four questions is a forecast. One that can't is a spreadsheet wearing a business case.
Next step: before your next forecast review, ask the team behind your simulator to name the estimator (first choice, RFC, mixed logit, or otherwise), confirm whether the design randomized the manipulation being tested, and check their published replication numbers against real human studies rather than taking share accuracy on faith. If you want a second opinion on a specific forecast, get in touch.