How to compare results across segments with crosstabs
An insights director holding a banner table where Segment A converts 15 points higher than Segment B, with a budget reallocation decision riding on that gap, needs more than the crosstab to act. A crosstab that compares results across segments tests association within one observational sample: a starred cell means the split differs here, not that segment membership caused it. Only a randomized experiment, run separately inside each segment and holding everything else constant, identifies whether the intervention actually produces the gap. Act on the crosstab without that second step and you're one confounder away from optimizing for the wrong segment.
- Crosstabs test association, not causation: a starred cell means the split differs in this sample, not that segment membership caused the difference (Qualtrics).
- Simpson's Paradox is the documented failure mode: a trend that holds in every subgroup can reverse once the subgroups are combined, driven by an uneven confounder (MoreSteam).
- Auto-generated crosstab cuts multiply false positives: hundreds of cuts run without correction turn "p<.05" into noise (Greenbook).
- Stated survey answers carry hypothetical bias, and because overclaiming need not be equal across segments, a rate difference can reflect who overclaims rather than what a segment would actually choose.
- The fix is structural: randomize the intervention inside each segment. A bigger table or a stricter p-value threshold doesn't touch the underlying problem.
What does a crosstab actually measure?
A crosstab measures the association between a segment variable and an outcome inside one observational sample. The standard workflow hasn't changed much in twenty years: pull a variable, cross it against segment, and flag cells that clear a chi-square or Z-test. Qualtrics, SurveyMonkey, and Kantar all document this as the complete method (Qualtrics). That workflow answers one question well: do these two groups look different in this dataset. It does not answer whether segment membership is the thing producing the difference, because nothing in a crosstab controls for what else moves alongside segment membership, age correlating with tenure, region correlating with channel mix, tier correlating with usage frequency. The table reports a correlation. A buyer reading it as a cause is making an inferential leap the table itself never licenses.
Why can a "significant" segment difference be the wrong signal?
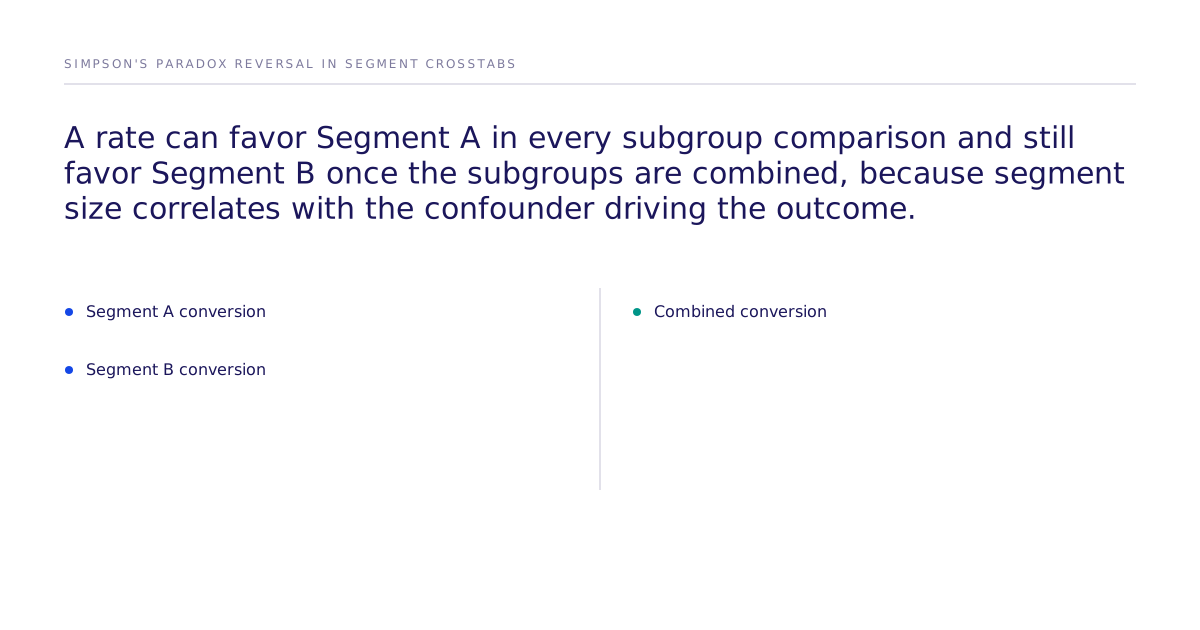
A significant crosstab cell can be the wrong signal because the segment variable is standing in for a confounder that's unevenly distributed across the groups being compared. This is Simpson's Paradox: a trend visible in every subgroup can reverse when the subgroups are pooled, precisely because segment membership correlates with something else doing the causal work (MoreSteam). A classic version: a product outperforms a competitor in every region when read separately, then loses overall once the regions are combined, because the region with the worst comparison also happens to carry most of the volume. Nothing in a chi-square test catches this. The test only tells you a cell differs from what chance would predict, not whether the variable you crossed is the one responsible.
The say-do gap hiding inside segment splits
Crosstabs are built on stated survey responses, and stated responses diverge from actual behavior: this is hypothetical bias, and there's no reason to expect the overclaiming to be equal across segments. If one segment tends to overclaim interest more than another, a "Segment A rates this 15 points higher" finding can be an artifact of who overclaims, not what Segment A would actually pick if the choice cost something. A crosstab has no mechanism to separate the two. It reports the stated number as if it were the behavior.
How many crosstab cuts can one dataset support before "significant" stops meaning anything?
A dataset can support far fewer significant cuts than most banner tables run, because every additional test raises the odds of a false positive unless the analysis corrects for it. Greenbook flags this directly: repeated significance testing across many crosstab cells in a single study inflates the false-positive rate when no correction is applied, and that's a common gap in standard banner-table workflows (Greenbook). AI-assisted platforms make this worse by volume, auto-generating hundreds of cuts per study, which increases both the false-positive count and the pressure on analysts to trust the automated star rather than check the underlying cell size. Cell size is the part the automated star doesn't show: a cell with too few respondents can flip significance on a handful of answers, and whether chi-square is even the right test gets shakier once segment sizes are unequal to begin with. The fix isn't a bigger p-value threshold, it's checking the underlying n before trusting the flag.
What does a randomized experiment inside each segment fix?
Publishing where a randomized experiment stops is what lets a buyer check the claim against the design. A randomized experiment fixes the confounding problem, but it identifies the effect of the intervention within the segment, not the effect of segment membership itself; segment is never randomized, so it's never a causal variable in the design. Instead of splitting an existing sample and comparing stated answers, the design randomly assigns the same intervention (a price, a message, a feature) within each segment's own sample, then compares outcomes between the randomized arms inside that segment. That isolates what the intervention does inside Segment A from what it does inside Segment B: if the effect size differs by segment, that's a real, causally identified difference in how each segment responds to the intervention, not evidence about what caused the segments to exist or differ in the first place. McFadden discrete choice and Mixed Logit are the estimators used to size the resulting effect from the randomized choices. McFadden's standard specification assumes independence of irrelevant alternatives (IIA); Mixed Logit relaxes that assumption by allowing preferences to vary across respondents, but neither estimator is what makes the result causal. The causal claim comes from the randomization in the experiment design, not from the choice model applied afterward. More on how that identification works sits on the methods and validation hub.
Crosstab vs randomized experiment by segment
| Crosstab / banner table | Randomized experiment by segment | |
|---|---|---|
| What it measures | Association between segment and outcome in one observational sample | Effect of a specific intervention within each segment, isolated from confounders by design |
| Confounders | Not controlled; a third variable can drive both segment membership and the outcome | Controlled by randomization; assignment within segment breaks the link between the confounder and the treatment |
| Say-do gap | Reads stated answers directly; gap size can vary by segment and inflate apparent differences | Still relies on stated or simulated choice, but the randomized comparison isolates the treatment effect from baseline overclaiming |
| Multiple comparisons | Hundreds of auto-generated cuts inflate false positives without correction | Each experiment tests one pre-specified intervention per segment |
| Output | A percentage and a p-value | A causal effect and a confidence interval bounding it within the tested population, conditional on the choice model's assumptions (McFadden's baseline specification assumes IIA; Mixed Logit relaxes it) |
| Best for | A quick descriptive read of who's in the data | A buyer about to reallocate budget or change messaging based on a segment gap |
Where does replication accuracy fit into this decision?
Replication accuracy tells a buyer how often this method has agreed with real human behavior before, which is a different question from whether any single result is right. A replication number without its limits is marketing, and the misses sit on the public leaderboard next to the hits. On the causal fidelity paper, our best configuration reaches 87% of the measured human ceiling on one study: 0.832 rank correlation against the published human result, where two independent samples of real humans reach 0.959. Across all 43 studies that pass design filters the mean is 0.73. That figure describes a validation result, not a guarantee for a market that hasn't been tested yet, and it comes with a real methodological caveat: some of the human studies in that set were published before the underlying models were trained, so the replication protocol has to account for the possibility that a model recalled an answer rather than derived it, not pretend that risk away. The leaderboard tracks replication accuracy by domain, so a buyer can check the number for a category close to their own before trusting it for a new decision.
What should a buyer do with this week's banner table?
Take the one segment split currently driving a budget or messaging decision, and ask whether it would survive a randomized version: same intervention, same two segments, assignment randomized within each. If nobody can answer that without more data, the crosstab hasn't yet earned the decision it's being used to justify. Design the experiment first: randomize the intervention inside each segment, hold the rest constant, and compare the treated and control arms within each group before reallocating anything based on the original table. For a look at how that kind of segment-level experiment gets designed and validated, the team walks through it on a call.