Creating a correlation matrix for conjoint simulations
A senior insights buyer evaluating a conjoint simulator needs to know what a correlation matrix can and cannot tell them before they trust its forecast. A statistic published without its limits is marketing copy. The direct answer: a correlation matrix confirms your experimental design is statistically well-behaved, or that simulated shares aren't tangled together by a modeling artifact. It cannot confirm the simulator predicts what real buyers would choose. That requires comparing simulated results against replicated human studies, not auditing the matrix's off-diagonal values.
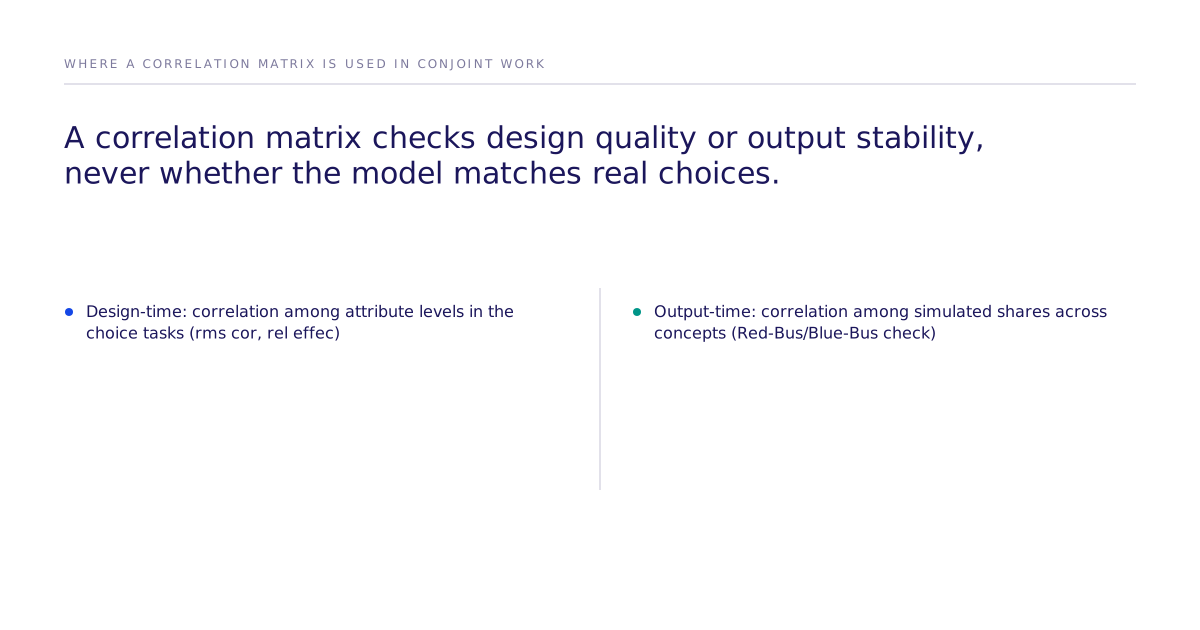
- A correlation matrix run at design time (Sawtooth's rms cor and rel effec) confirms the choice tasks in your survey aren't collinear enough to blow up your effect estimates.
- A correlation matrix run at output time, across simulated shares, flags when two concepts move together so tightly the simulator is likely double-counting them, the Red-Bus/Blue-Bus problem.
- Naming a gap in a diagnostic is what lets a buyer check it before trusting a forecast. Neither check tells you whether the underlying choice model matches how real people choose. That's a separate validation step against a human baseline.
- Fixing double-counting is a modeling choice, First Choice or Randomized First Choice simulation instead of plain Share-of-Preference logit, not something you find by reading a matrix more carefully.
- Correlated price and quality attributes in your design are often intentional, conditional pricing exists to avoid dominated, unrealistic profiles.
Two places a correlation matrix shows up in conjoint work
Market simulators take part-worth utilities from a conjoint study and convert them into simulated choice shares, so a team can test a hypothetical product scenario before it ships (Sawtooth Software, 2019). Practitioners build correlation matrices at two separate points in that workflow, and it's easy to conflate them because both produce a matrix of numbers that looks like the same kind of check.
The first point is design time: does the survey itself produce clean, independent signal. The second is output time, after the simulator has run: do the simulated shares move independently, or does the model appear to be counting the same preference twice. A matrix that looks clean at one point says nothing about the other.
What Sawtooth's design-time diagnostics actually measure
Sawtooth Software, the dominant CBC vendor, reports two statistics from a respondent's design correlation matrix: rms cor, the root-mean-square of its off-diagonal elements, and rel effec, relative estimation efficiency calculated from the inverse of that matrix. Both are core design-quality statistics in Sawtooth's CBC output.
These numbers answer one question: did the experiment collect signal clean enough to estimate stable part-worths. They say nothing about whether the resulting simulator, once you feed it new product scenarios, predicts what people would actually pick. A well-designed experiment can still sit inside a poorly validated simulator.
What the output-time correlation matrix catches: the Red-Bus/Blue-Bus problem
A correlation matrix of simulated shares exists to catch one specific failure: near-identical concepts inflating each other's combined share because the model can't tell they're substitutes rather than distinct options. Sawtooth's classic illustration repaints half a bus company's fleet blue and adds it back into a Share-of-Preference simulation. The result nearly doubles the bus company's predicted total share, because the logit model double-counts the two nearly identical bus options instead of treating them as substitutes for the same trip (Sawtooth Software, Red-Bus/Blue-Bus).
This is the independence-of-irrelevant-alternatives (IIA) assumption failing. A flat Share-of-Preference logit assumes every option is equally substitutable with every other option, so adding a near-clone of an existing product inflates the total share of that product line rather than splitting share the way it would in a real market. A correlation matrix of simulated shares will show the red bus and blue bus moving together almost perfectly, which is the signal practitioners look for. But catching the symptom isn't the same as fixing the cause, and it doesn't tell you whether the model was ever right about substitution in the first place.
Fixing substitution bias is a modeling decision, not a matrix-reading exercise
Once a correlation matrix flags a Red-Bus/Blue-Bus pattern, the fix lives in the choice model, not in re-reading the matrix more carefully. Sawtooth's own guidance is direct: First Choice simulation models are not subject to IIA bias at all, and Randomized First Choice shows much less IIA bias than standard Share-of-Preference logit models (Sawtooth Software, 1999).
That's the practical decision point for a buyer evaluating a simulator: which share-prediction method does it run by default, and can you switch it. A simulator that only offers plain Share-of-Preference logit will keep producing this distortion regardless of how disciplined its correlation diagnostics look.
Correlated price and quality attributes are sometimes the point
Not every correlation in a design is a defect to be designed away. If price and quality attributes are varied independently, the experiment can generate profiles no real buyer would recognize, a premium feature bundle offered at a bargain price, for instance, which the market itself would never present. Sawtooth's 2025 guidance on price treatment recommends conditional or incremental pricing specifically to reintroduce the price-quality correlation buyers expect from real markets, avoiding these dominated, unrealistic profiles (Sawtooth Software, 2025).
So a design-time correlation matrix showing some correlation between price and quality levels isn't automatically a red flag. The right question is whether that correlation was put there deliberately, to match how the market actually prices products, or whether it leaked in as an accident of a poorly randomized design.
Does a clean correlation matrix prove your simulator is accurate?
An honest answer here costs a claim, and it goes on the page anyway. No. A clean correlation matrix, at either the design stage or the output stage, proves that the numbers are well-behaved. It does not prove the choice model behind those numbers matches how real people choose.
This is the gap that matters for a buyer making a real purchase decision. Red-Bus/Blue-Bus is diagnosed by looking at share correlations, but it's caused by a model-validity failure: a Share-of-Preference logit that was never checked against observed human substitution behavior. That model can produce a mathematically tidy correlation matrix at every stage and still misrepresent how buyers would actually split their choices between a new product and an existing one it resembles. Auditing the matrix optimizes the wrong layer. It tells you the arithmetic is internally consistent, not that the arithmetic describes the market.
How do you actually validate a conjoint simulator against real behavior?
You compare the simulator's predictions against a held-out human study and measure how often it reproduces the same direction and outcome, not against its own correlation diagnostics. That's a different kind of check: it requires an independent human baseline, run separately from the simulation, and a defined replication protocol for scoring agreement.
This is also where method choice matters, precisely stated. McFadden's discrete choice model, Mixed Logit, and ICLV are estimators used to analyze choice data, not causal methods in themselves. Causal identification comes from the randomized manipulation built into the experiment design, the same randomization that lets a study distinguish "people chose this product" from "people chose this product because of this specific attribute." Written accurately, the claim is randomized experiments analyzed with discrete choice models, not "causal methods like DCE."
Our best configuration reaches 87% of the measured human ceiling on one study: 0.832 rank correlation against the published human result, where two independent samples of real humans reach 0.959. Across all 43 studies that pass design filters the mean is 0.73, measured against a set of held-out human studies (the causal fidelity paper). The misses sit on the same public leaderboard as the hits, so two of them are worth stating directly. Two limitations matter here. First, it's a validation-set result, not a guarantee for a new, unseen market; a simulator that replicates well on past studies can still miss on a market structure it hasn't been checked against. Second, published human studies can sit inside a model's training data, which would inflate apparent replication if the model had simply memorized the answer; the replication protocol is built to guard against this, but the underlying risk doesn't disappear just because a protocol exists. Results and methodology are published on the leaderboard, which lets a buyer check replication performance directly instead of taking a vendor's summary number on faith. More on how this validation work is structured is on the methods and validation hub.
Where each check belongs
| Design correlation diagnostics (rms cor, rel effec) | Share correlation matrix (Red-Bus/Blue-Bus check) | Human-baseline validation | |
|---|---|---|---|
| What it measures | Whether the experiment's attribute levels are collinear | Whether simulated concepts move independently | Whether simulated results match a replicated human study |
| What it catches | Unstable part-worth estimates from a bad design | Near-duplicate concepts inflating combined share | A model that gets the direction or magnitude of real behavior wrong |
| What it misses | Whether the model matches real choice behavior at all | The cause of substitution bias, only its symptom | Nothing at the layer it checks, but it needs a real held-out study to run |
| Best for: | Confirming a survey is ready to field | Screening a simulator's output before trusting a share forecast | Deciding whether to trust the simulator's forecast at all |
Before trusting any simulator's forecast, ask for its replication rate against held-out human studies, not just its design diagnostics or a clean share correlation matrix. If a vendor can't produce that number with a defined method, treat the forecast as unvalidated regardless of how disciplined its matrices look. If you want to walk through how a specific validation compares against your current simulator setup, meet with us.