Getting the top and bottom levels from conjoints
Getting the top and bottom levels from a conjoint means pulling each respondent's utility scores for the highest- and lowest-scoring levels and running a matched-sample test on the gap between them. A pricing or product lead staring at a conjoint chart has one decision to make: ship against the ranking on screen, or test it first. The direct answer: pull the top and bottom levels, run a matched-sample significance test on the per-respondent utility difference between them, and only call one a winner if the confidence interval clears zero. Everything before that step is a ranking; only the number that survives the test is a causal effect you can defend to a roadmap committee or a pricing board.
- The top level in a conjoint chart is not automatically preferred, and the bottom level is not automatically rejected, until a matched-sample significance test confirms the gap survives sampling error (Sawtooth Software).
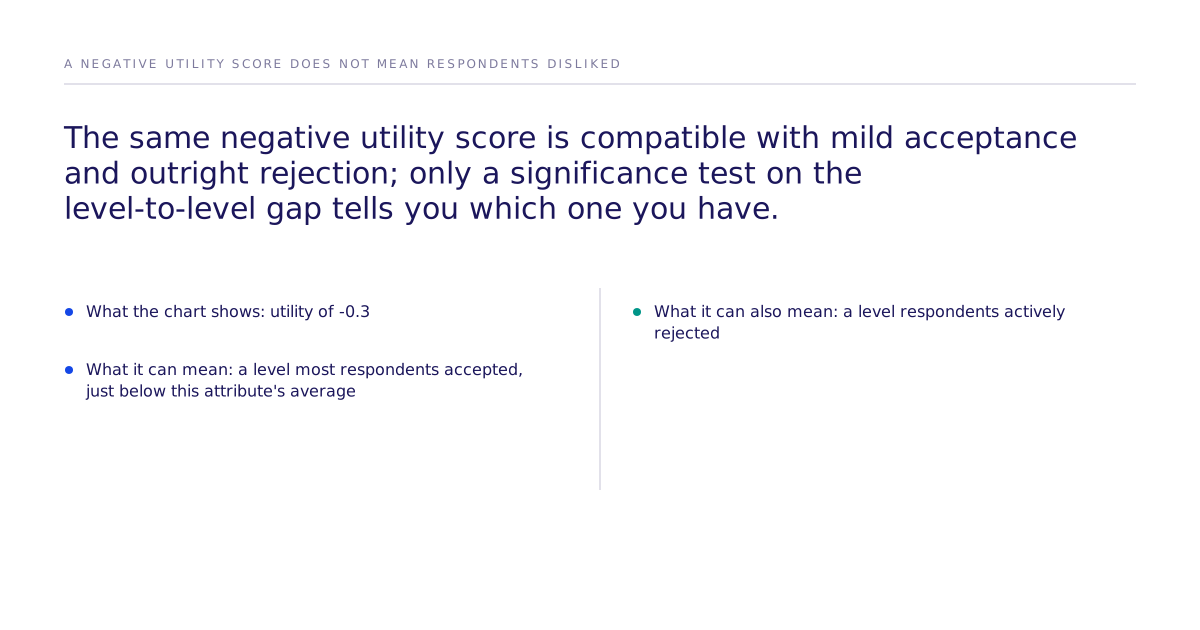
- Naming a failure mode in a chart is what lets a buyer check it before acting on it. Part-worth utilities are zero-centered within each attribute by construction, so a negative score means a level scored below that attribute's average, not that respondents disliked it in absolute terms (Sawtooth Software).
- The range of levels a researcher chooses to test mechanically changes how important that attribute looks, which can flip which level appears to win (Marketing Letters).
- Sawtooth's own guidance recommends the matched-sample t-test precisely because hierarchical Bayes output doesn't flag significance on its own (Sawtooth Software); running it is the analyst's job, not the software's.
- A randomized experiment analyzed with discrete choice models and checked against a human baseline adds a causal check the standard workflow skips: Subconscious's best configuration reaches 87% of the measured human ceiling on one study (0.832 rank correlation against a 0.959 human-to-human ceiling; mean 0.73 across the 43 studies passing design filters), per the causal fidelity paper, a validation result, not a promise for a specific new market.
Why isn't the highest-utility level automatically the winner?
It isn't the winner because conjoint utilities are zero-centered within each attribute by construction: scores rank levels relative to each other, not in absolute terms. Sawtooth Software's own documentation says a level with negative utility is not necessarily unattractive, only worse than the other tested levels, and that reading a t-value on the raw utility can mislead you into treating a small, noisy gap as real preference (Sawtooth Software). The "loser" in a price or feature test might still be a level most customers would accept; it just lost a relative contest against the levels you chose to include.
How do you test whether the gap between top and bottom is real?
You test it with a matched-sample significance test, not a visual comparison of chart heights. Sawtooth's guidance for practitioners: compute the mean of each respondent's individual utility difference between the two levels, then divide by the standard error of that difference, the standard matched-sample t-test applied at the respondent level rather than to aggregate scores (Sawtooth Software). A "top" and "bottom" level separated by a small margin on the chart can have overlapping confidence intervals once you account for how much individual respondents disagree. A gap that looks decisive in aggregate can evaporate once you check it person by person.
Three ways to read the same conjoint output
| Approach | What it does | What it misses | Best for |
|---|---|---|---|
| Eyeball the bar chart | Ranks levels by mean part-worth utility | Whether the visible gap is signal or noise | A first pass, never the final call |
| Matched-sample significance test | Divides the mean per-respondent utility difference by its standard error | Assumes the tested range of levels was chosen well; doesn't check whether the ranking holds if a level outside that range gets added | Confirming a specific ranking claim survives real variance |
| Randomized experiment analyzed with discrete choice models, checked against a human baseline | Estimates individual-level utilities from a randomized design, compared against held-out human data | 87% of the measured human ceiling (0.832 against a 0.959 human-to-human ceiling; mean 0.73 across the 43 studies passing design filters) is a validation result, not a market guarantee ([paper](https://fidelity.subconscious.ai/papers/causal-fidelity/causal_fidelity_paper.pdf)) | A buyer who has to defend the ranking as a causal claim, not just a description |
Why does the range of levels you test change the ranking?
Attribute importance in conjoint derives from the spread between a study's highest and lowest tested levels, so widening or narrowing that spread mechanically moves how important the attribute looks. A Marketing Letters study found that tripling the range of tested levels changed derived importance estimates by about as much as adding two more intermediate levels did (Marketing Letters); one study, one category, and the size of the effect elsewhere is untested. A related Marketing Letters paper found that adding intermediate levels inflates an attribute's derived importance even when the endpoints stay fixed (Marketing Letters). The "losing" price point in your last study might win the next one if you add a cheaper anchor, not because customers changed their minds, but because you changed the ruler.
What does this mean for a pricing or roadmap decision?
The standard conjoint workflow gives you a ranking, not, by itself, a tested causal claim. Sawtooth's own hierarchical Bayes output doesn't flag statistical significance automatically; the analyst has to run the matched-sample test and check whether the tested range was reasonable before treating a top or bottom level as a decision input (Sawtooth Software).
Stated willingness to pay runs high relative to what people actually spend, unless the design is incentive-aligned. A conjoint ranking is a stated preference, not a real transaction, so a top level's price should not be treated as what people will actually pay without naming that bias to a pricing board first.
If you're building a roadmap or a pricing tier off a conjoint chart, the discipline is the same either way: test the gap before you build around it, and know what the design of the study did to the result.
Where does a causal read fit in?
It fits in as the layer above the significance test: a randomized experiment analyzed with discrete choice models, checked against a real human study rather than assumed accurate. McFadden discrete choice, Mixed Logit, and ICLV are estimators, not causal methods on their own; causal identification comes from the randomized manipulation built into the experiment design, not from whichever choice model analyzes the responses afterward. Standard logit also carries the independence of irrelevant alternatives assumption; Mixed Logit and ICLV exist partly to relax it where preferences correlate across respondents or tested alternatives look like close substitutes.
This is where the fidelity result does its work: our best configuration reaches 87% of the measured human ceiling on one study, 0.832 rank correlation against a 0.959 human-to-human ceiling, with a mean of 0.73 across the 43 studies passing design filters, per the causal fidelity paper; a validation result, not a promise for a market you haven't tested yet. Studies are held out specifically because published research can sit inside a model's training data, which would otherwise let a study "pass" by memorization rather than genuine prediction. Full results by study are on the leaderboard; the confidence interval from that kind of experiment covers the simulated population studied, not the real market unconditionally.
Should you trust a synthetic panel instead of running a conjoint at all?
Not without checking what it's validated against; the same discipline applies here as to a conjoint chart, a ranking isn't a finding until it's tested. LLM-based "digital twin" synthetic-respondent tools are now competing for the same buy decision conjoint has served for decades. The question worth asking any such vendor: does the design include a randomized manipulation you can attribute a preference shift to, the way a conjoint's experimental design does, and what's the replication rate against real human studies, held out to prevent memorization. For a broader look at how discrete choice models get validated, the methods and validation hub has more on the underlying estimators.
Concrete next step: before a roadmap or price change ships off a conjoint chart, pull the raw per-respondent utilities for the top and bottom levels and run the matched-sample t-test Sawtooth describes. If the interval crosses zero, the ranking isn't a finding yet; it's a hypothesis. If you're weighing whether a causal, randomized read belongs in your next study, the team is worth a conversation.