Willingness to Pay: What It Is and How to Measure It
A pricing lead deciding what to charge for a new product needs an answer to one question: how much will customers actually pay, not what they say they would pay on a survey. Willingness to pay is the price at which a customer's choice tips from buying to walking away, a causal effect of price on behavior, not a number people report on a form. Measuring it well means running an experiment that manipulates price and observes the resulting choice, then checking that estimate against real behavior, because stated answers alone tend to overstate WTP by roughly three times on average, according to decades of hypothetical-bias research, including List and Gallet's meta-analysis of 29 payment experiments.
- Willingness to pay is the price point where a customer's choice shifts from buying to not buying, a causal effect of price on behavior, not a self-reported number.
- The three common measurement tools are Van Westendorp's Price Sensitivity Meter, Gabor-Granger sequential pricing, and conjoint or discrete choice analysis.
- Stated WTP figures run high by a well-documented margin, roughly three times actual willingness to pay on average (List and Gallet), unless the design is validated against real payment behavior.
- Conjoint analysis reduces hypothetical bias by forcing trade-offs, but it does not eliminate it without a validation step.
- A trustworthy WTP number comes with a stated accuracy rate against real behavior and a confidence interval, not a point estimate alone.
What does willingness to pay actually measure?
Willingness to pay measures a causal effect: how much price has to move before a customer's choice moves with it. That is different from asking someone to name a number. A stated dollar figure is a survey answer. A WTP estimate, done right, comes from an experiment where price is randomized or systematically varied and the outcome is an actual choice, then the relationship between the two is estimated statistically. The distinction matters because the two produce different numbers, and the gap between them is large enough to sink a pricing decision.
How do you measure willingness to pay?
Three tools dominate pricing research, and they differ mainly in how directly they ask for a price. Van Westendorp's Price Sensitivity Meter uses four contextual questions (too cheap, a bargain, getting expensive, too expensive) instead of one direct ask. Gabor-Granger tests a sequence of yes-or-no purchase decisions at fixed price points to trace out a rough demand curve. Conjoint and discrete choice analysis put price alongside product features in repeated trade-off tasks, so a respondent is choosing a bundle, not naming a figure. Conjoint is often called the gold standard because a trade-off task looks more like a real purchase decision than a direct question does. Some researchers have also proposed modified direct-question formats built specifically to shrink the overstatement problem, tested in a de-biased direct-question approach to measuring WTP, though the core issue, a stated answer standing in for a real purchase, persists unless the result is checked against actual behavior.
| Method | How it works | Strength | Weakness |
|---|---|---|---|
| Van Westendorp PSM | Four contextual price questions, no direct "what would you pay" | Fast, avoids anchoring on a single price | Produces a range, not a defensible point estimate. Best for: early-stage price range sanity checks. |
| Gabor-Granger | Sequential yes/no purchase intent at set price points | Simple to run, yields a demand curve shape | Still a stated purchase intent, not an observed choice. Best for: quick internal price-ladder tests when a rough curve is enough. |
| Conjoint / discrete choice | Price traded off against features across many choice tasks | Forces trade-offs, closer to real purchase behavior | Remains a stated-preference method unless validated against real payment data. Best for: pricing decisions where price interacts with features and the design has been validated. |
Why do stated WTP numbers run high?
Stated WTP does not fail randomly. It fails in one direction: high. List and Gallet's meta-analysis of 29 hypothetical-versus-real payment experiments found that subjects overstate valuations by roughly a factor of three on average (List and Gallet, 2001). A 2019 meta-analysis in the Journal of the Academy of Marketing Science reached a similar conclusion across consumer goods studies, and found the size of the gap depends heavily on design choices, including question wording and whether payment is real or hypothetical. A method's remaining gap belongs in public alongside its strength. Conjoint's trade-off structure narrows this gap, since choosing between bundles is closer to a real purchase than naming a dollar figure, but it is still a stated-preference method unless it has been calibrated against actual payment behavior. This is also why researchers who study revealed versus stated preference generally favor data from real transactions when it is available: stated answers are vulnerable to social-desirability effects and hypothetical-scenario bias that are difficult to control for after the study is fielded, per Scioto Analysis.
Are AI synthetic panels a shortcut, or the same problem at a new speed?
They are a speed and cost shortcut, not automatically a bias fix. A wave of AI synthetic panel vendors now pitch WTP studies that run in hours instead of weeks, at a fraction of traditional fielding cost, with accuracy claims measured against human benchmarks that vendors rarely define in public. What most of these claims leave out is the second half of the sentence: accuracy against what. A held-out human sample run on the same design, an actual purchase outcome, or nothing published at all, are three very different bars, and a vendor's number is only as good as the comparison behind it. A synthetic panel that reproduces the same hypothetical-bias-prone survey question, just faster and on simulated respondents, has not solved the problem List and Gallet documented. It has automated it.
What does a validated WTP estimate look like?
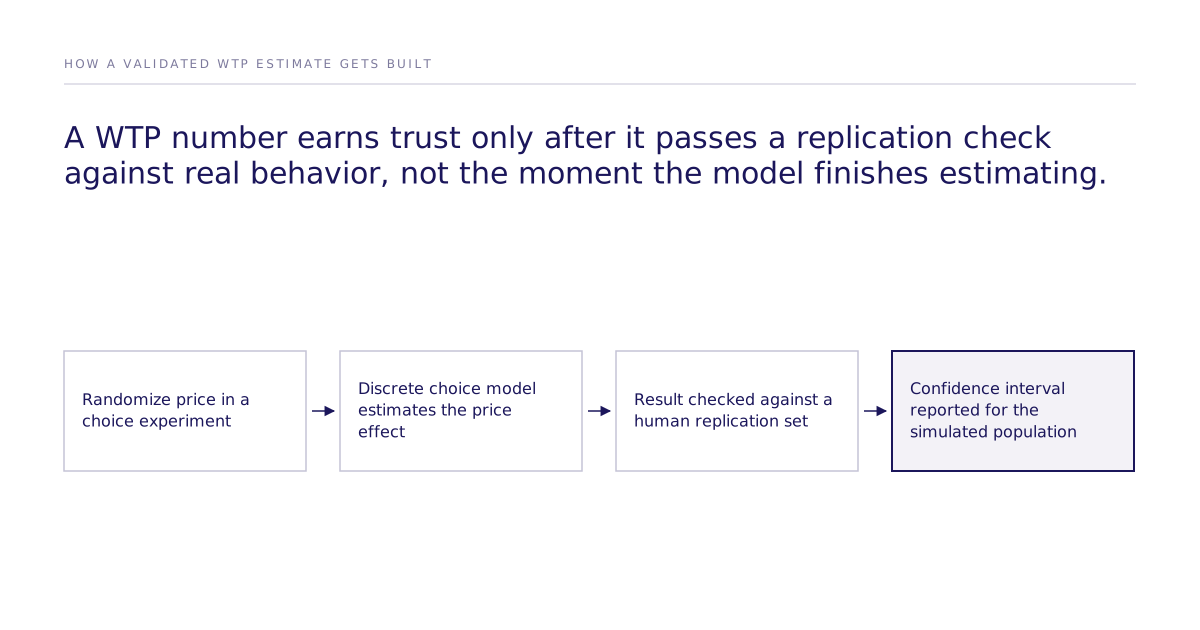
It looks like a randomized experiment analyzed with a discrete choice model, checked against real human behavior, with a stated accuracy rate and a confidence interval attached. McFadden discrete choice, Mixed Logit, and ICLV are estimators for that kind of experiment, not causal methods on their own. Causal identification comes from randomizing the manipulation, typically price, inside the experiment design, not from the statistical model applied afterward. McFadden's base discrete choice model assumes independence of irrelevant alternatives (IIA), meaning adding or removing an option should not change the relative odds between two others, an assumption that often does not hold for real preference share and substitution questions. Mixed Logit relaxes that assumption by letting preferences vary across the simulated population, and ICLV adds a layer for attitudes and perceptions a plain choice model cannot observe directly.
Subconscious runs randomized experiments on a simulated population and checks the result against real human studies before reporting a number. Our best configuration reaches 87% of the measured human ceiling on one study: 0.832 rank correlation against the published human result, where two independent samples of real humans reach 0.959. Across all 43 studies that pass design filters the mean is 0.73. See the causal fidelity paper. A number earns trust once its limits are attached to it. That is a validation-set result, not a guarantee for a brand-new market. The comparison against other approaches is public on the leaderboard, which ranks performance against held-out human studies rather than self-reported accuracy claims. Because some of those human studies could exist inside a model's training data, the replication protocol is built to test against outcomes rather than memorized text, though the risk that a model has seen a study before cannot be fully ruled out for any AI system. A confidence interval from a simulated experiment covers the effect within that simulated population. It does not unconditionally bound what will happen in the real market.
Which method should a buyer trust for a real pricing decision?
Trust the method that names its error, not the one with the cleanest chart. Van Westendorp and Gabor-Granger are fine for a fast internal sanity check on price range, but neither is built to survive a board question about how confident the number is. Conjoint and discrete choice designs get closer to real behavior because they force trade-offs, and they become defensible once validated against a real or held-out benchmark with a stated accuracy rate, in the way the methods and validation work at Subconscious is built to be checked. A WTP figure without a validation step and a confidence interval is a guess with decimal points attached.
Before commissioning another WTP study, ask the vendor one question directly: accuracy against what, and can they show the number. If the answer is a percentage with no comparison behind it, that is the hypothetical-bias problem wearing a new interface. If it is useful to walk through how a replication-checked design would apply to a specific pricing decision, /meet is open.