How to simulate and validate your SaaS pricing before you launch
A VP of Pricing or Growth setting a SaaS launch price is choosing between two different measurements: what a customer says a price feels like, and what a customer will actually pay. Simulating and validating that price before launch means running a randomized experiment that manipulates price and packaging and measures the resulting choice, with a confidence interval attached to the measurement. The two standard pre-launch tools, Van Westendorp and choice-based conjoint, only capture the first measurement: stated perception, not purchase behavior. A price range customers rate as fair is not a forecast of what they'll buy; only a controlled experiment with a counterfactual proves the causal effect of a specific price on the purchase decision.
- Van Westendorp maps where a price starts to feel expensive or cheap. It does not test whether the respondent would buy at that price (Relevant Insights).
- Choice-based conjoint forces price-feature trade-offs, but practitioners flag it as unreliable specifically for estimating price elasticity, which is the one number a launch decision actually needs.
- One 2026 buyer's guide recommends 200-300 respondents for stable Van Westendorp curves, run sequentially before conjoint (Koji).
- Skipping causal validation has a measured cost: software companies sacrifice 11-17 percent of annual revenue to pricing and contracting mistakes (Simon-Kucher).
- A number published without its limits is marketing. A simulated pricing experiment can be checked against real human studies: our best configuration reaches 87% of the measured human ceiling on one study (0.832 rank correlation against the published human result, where two independent samples of real humans reach 0.959; mean 0.73 across the 43 studies passing design filters), a validation result, not a guarantee for a market that hasn't been tested. See the causal fidelity paper.
What Van Westendorp and conjoint actually measure
Van Westendorp asks four questions about a single product: at what price does it feel too cheap, a bargain, getting expensive, and too expensive to consider. Plotting the answers produces an "acceptable range," and 2026 buyer's guides now pair that range with choice-based conjoint, which asks respondents to trade features against price across a series of forced choices. One such guide treats this as a sequential pipeline, Van Westendorp first to bound the range, then conjoint to see which packaging holds up inside it, and recommends a minimum of 200 respondents, with 250-300 preferred, for the curves to stabilize (Koji). Both steps are self-report. Nobody in either survey commits money, and nobody sees a randomized version of the price they didn't get.
Does a price that feels fair predict what customers will buy?
No. A price a respondent rates as acceptable is a statement about comfort, not a commitment to purchase, and the two are not the same measurement. Critiques of Van Westendorp point out directly that it measures perceptual price thresholds, how a number feels, not whether the respondent would act on it (Relevant Insights). This is the say-do gap: environmental and behavioral economics has documented, repeatedly, that what people say they'd pay runs ahead of what they actually pay once real money is on the line. Stated willingness-to-pay is biased upward unless the design forces a real cost on the respondent, a problem known as hypothetical bias. Conjoint improves on Van Westendorp by forcing trade-offs instead of open comfort ratings, but it's still conducted in isolation from real market conditions, which is why practitioners flag it as a weak tool specifically for estimating price elasticity, the input a pricing launch decision actually runs on.
What actually proves a causal effect on the purchase decision
A randomized experiment does. The design assigns different respondents, or the same respondents across randomized scenarios, to different price and packaging combinations, holds everything else constant, and measures which option they choose.
That randomization is what identifies a causal effect. The difference in choice rates between price conditions can be attributed to the price itself, not to who happened to answer the survey.
Discrete choice experiments (DCE), Mixed Logit, and Integrated Choice and Latent Variable (ICLV) models are the estimators used to analyze the resulting choice data. They are not themselves the source of causal identification. The causal claim comes from the randomized manipulation in the experiment design; the models turn the resulting choices into an effect size and a confidence interval.
That interval describes the effect within the population tested in the experiment. It is not a claim about the entire real market unconditionally.
One detail matters for packaging questions specifically. A flat multinomial logit model assumes the independence of irrelevant alternatives, meaning it can misrepresent how customers substitute between tiers when a new package is added. Mixed Logit relaxes that assumption, which is why it's the workhorse for packaging trade-offs rather than a simple logit.
What does a bad pricing decision cost?
Simon-Kucher's survey of more than 500 software executives found that companies sacrifice 11-17 percent of total annual revenue to pricing and contracting mistakes (Simon-Kucher).
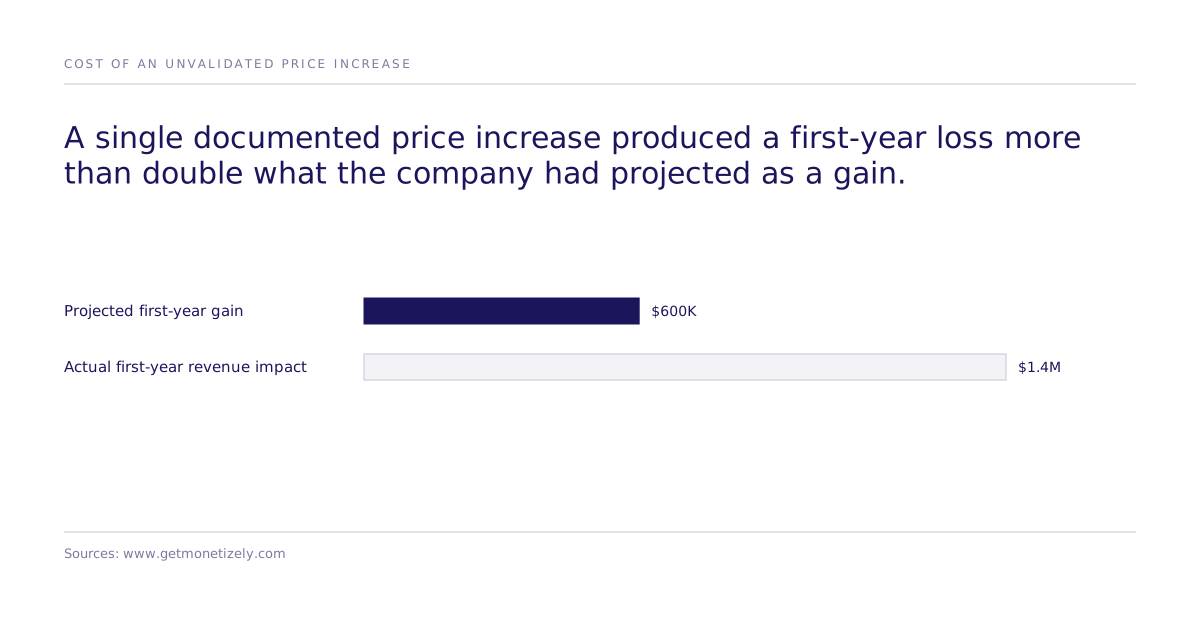
A documented case study makes the shape of that loss concrete: one SaaS price increase produced a first-year revenue impact exceeding $1.4 million, more than double the $600,000 gain the company had projected before launch (Monetizely). It is a single documented case, not a sample, and the company shipped the price without a randomized counterfactual test of the alternative. That absence is the specific gap a randomized pricing experiment closes.
How do you validate a simulated pricing experiment against real behavior?
By replaying it against studies where the human answer is already known and checking whether the simulation reproduces the same direction and outcome. The misses sit on the public leaderboard next to the hits. Our best configuration reaches 87% of the measured human ceiling on one study: 0.832 rank correlation against the published human result, where two independent samples of real humans reach 0.959. Across all 43 studies that pass design filters the mean is 0.73. See the causal fidelity paper. It is a validation result, not a guarantee that it will hold in a market nobody has tested yet. It also carries an honest limitation worth stating plainly: published studies can sit inside a model's training data, which is exactly the kind of contamination a replication protocol has to be built to check against rather than assume away. The running set of replicated studies and their accuracy scores is public on the leaderboard, so a buyer can check the track record on a category close to their own before trusting a result.
Choosing a pricing validation method
| Method | What it captures | Confidence interval on purchase decision? | Known limitation |
|---|---|---|---|
| Van Westendorp | Perceived price fairness, a self-reported comfort threshold ([Relevant Insights](https://www.relevantinsights.com/articles/van-westendorp-price-sensitivity-meter/)) | No | Measures a feeling, not a purchase commitment. Best for: a fast, cheap gut-check on a price range early in discovery. |
| Choice-based conjoint | Stated trade-offs between price and features, conducted in isolation from real market conditions | No | Flagged by practitioners as unreliable specifically for estimating price elasticity. Best for: ranking which features a segment values, not for setting a price point. |
| Randomized causal experiment (analyzed with DCE, Mixed Logit, or ICLV) | The effect of a manipulated price and packaging combination on the resulting choice, with a counterfactual | Yes, for the population tested in the experiment | The leaderboard puts the misses next to the hits, so the ceiling is stated here directly. Validated at 87% of the measured human ceiling (0.832 against a 0.959 human-to-human ceiling; mean 0.73 across the 43 studies passing design filters); not a guarantee for an untested market. Best for: the launch decision itself, where the input needed is a causal effect on purchase behavior. |
Where this fits before a launch decision
Run the randomized experiment before the price goes live, not after a survey has already anchored the team on a number. Manipulate price and packaging across the segments that matter, size the sample to the segments you need a confidence interval for rather than a flat 200-300 rule of thumb, and treat the resulting effect size as the input to the launch decision, not the survey's "acceptable range."
Next step: write down the specific price and packaging comparison you need an answer to, then check the leaderboard for a replicated study in a category close to yours to see how the method has performed on something you can verify. If you want a second set of eyes on the design, meet the team.