PyMC-Marketing vs. Meridian: What a Baseline-Modeling Benchmark Shows About MMM Attribution
A marketing mix model can hit a strong R² and still get channel attribution wrong. Those are two different questions: does the model predict total sales well, and does it correctly separate how much of that outcome came from each media channel versus the underlying trend. A team that checks only the first question can reallocate budget away from a channel that actually worked, because the model absorbed that channel's true effect into a flexible baseline term instead of assigning it to media.
That gap is the subject of a third-party benchmark comparing two open-source MMM libraries, PyMC-Marketing and Google's Meridian, on synthetic data with known, true channel contributions. Because those contributions are known, the benchmark can score each library on whether it recovered the right answer, not just whether it fit the observed sales curve.
The two questions a fit metric can't answer
Goodness-of-fit metrics like R² and MAPE measure how closely predicted sales track observed sales, not whether that variation was assigned to the right source. A flexible baseline term can track short-term sales fluctuations closely, improving fit while quietly absorbing variation a media channel actually caused.
Contribution-recovery metrics (bias, standardized root-mean-squared error (SRMSE), and CRPS on the recovered channel effects) measure the second question directly, because the benchmark's synthetic data has a known ground truth for each channel's contribution.
What did the benchmark measure?
The benchmark evaluated PyMC-Marketing and Meridian across three small, growing, and medium-sized synthetic datasets on three dimensions: sampling convergence, in-sample predictive fit, and contribution recovery. Meridian's newest release automates spline-knot selection for its time-varying baseline; this round tested that change against the same datasets and generating process as the library's earlier round.
The two libraries model trend and seasonality differently. PyMC-Marketing uses explicit Fourier terms for seasonality with an optional Gaussian process for longer trend. Meridian models both trend and seasonality with a single spline baseline, now sized automatically by the new knot-selection routine.
The table reports the benchmark's own published figures as historical results from that specific run of PyMC-Marketing v0.17.0 against Meridian v1.2.1. They describe one synthetic-data study, not a live measurement of either library's current performance.
| Business size (benchmark's own figures) | Library | R² (higher = better fit) | MAPE % (lower = better fit) | Durbin-Watson (closer to 2 = less autocorrelated residuals) | Bias on contribution recovery (lower = better) | SRMSE on contribution recovery (lower = better) |
|---|---|---|---|---|---|---|
| Small Business | PyMC-Marketing | 0.871 ± 0.020 | 7.10 ± 0.60 | 1.97 ± 0.17 | 82 ± 207 | 0.41 ± 0.23 |
| Small Business | Meridian | 0.930 ± 0.009 | 5.10 ± 0.40 | 1.89 ± 0.17 | 219 ± 259 | 0.66 ± 0.24 |
| Growing Business | PyMC-Marketing | 0.884 ± 0.015 | 6.70 ± 0.50 | 1.85 ± 0.15 | 56 ± 158 | 0.42 ± 0.34 |
| Growing Business | Meridian | 0.941 ± 0.004 | 4.70 ± 0.20 | 1.67 ± 0.09 | 49 ± 185 | 0.54 ± 0.49 |
| Medium Business | PyMC-Marketing | 0.954 ± 0.006 | 5.00 ± 0.30 | 1.88 ± 0.14 | 522 ± 2175 | 0.16 ± 0.09 |
| Medium Business | Meridian | 0.968 ± 0.002 | 4.20 ± 0.20 | 1.42 ± 0.06 | 1664 ± 3317 | 0.29 ± 0.24 |
In this benchmark's own account, Meridian's automated knot selection improved in-sample R² and lowered MAPE across every dataset size after the update. In the same runs, Meridian showed higher bias, higher SRMSE, and lower Durbin-Watson statistics than PyMC-Marketing on contribution recovery, and the benchmark reports greater leakage of media signal into the baseline term as knot flexibility increased.
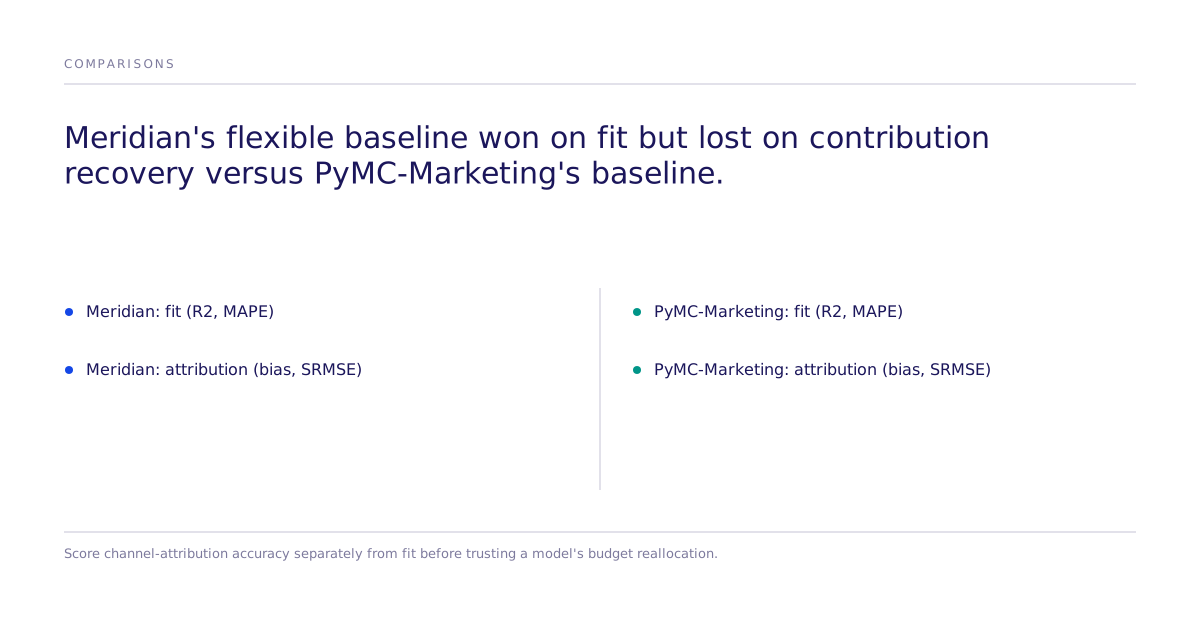
Why can a more flexible baseline look better and mislead at once?
A lower Durbin-Watson statistic means residuals are more autocorrelated: the baseline tracks short-term noise instead of modeling seasonality as an explicit structure, which can inflate in-sample fit while obscuring how much of a lift came from media versus the baseline. Out-of-sample performance was not part of this benchmark round.
What is the saturation problem that no library escapes?
The benchmark identifies a separate, structural limit that applies to both libraries: channels that saturate quickly are hard to recover accurately. Contribution recovery depends on spend varying within a channel's non-saturated response range; past that point, extra spend barely moves the outcome, so spend and sales stop moving together, and the model loses its ability to tell that channel's true effect apart from the baseline, even when the data still has plenty of spend fluctuation. A more flexible baseline makes this worse, because it can more easily absorb the variation that should have been assigned to the saturated channel.
Checking your own model before moving budget
This benchmark's warning applies past these two libraries: fit metrics and attribution metrics answer different questions, and passing one says nothing about the other. Before reallocating spend on a model's contribution numbers, the model's recovered contributions need their own check, separate from R² or MAPE.
Subconscious approaches this by running controlled experiments on simulated buyers, and Subconscious can test or validate a study's findings with real human participants, moving from simulation to real-human validation without changing the causal question. See how these experiments are structured on how Subconscious works and how results compare against real outcomes on the replication leaderboard.
Limitations of this benchmark
This is one third-party synthetic-data study of two specific open-source library versions, not a Subconscious study, a real-company dataset, or a ranking of MMM vendors in general. No pricing, speed, or accuracy claim about either library should be read as current: neither library was verified, run, or endorsed by Subconscious in this benchmark, and both continue to change with new releases. The figures above describe the versions tested at the time of that study.
Next step
If your team is deciding whether to trust an MMM's channel attribution before shifting budget, see what Subconscious tests differently and where a controlled experiment can check a contribution number a fit metric alone cannot confirm.