Testing EV Buyer Segments, Feature Trade-offs, and Price Tiers Before Automotive Launch Spend
Automotive product, pricing, and marketing leaders can commit engineering, tooling, and campaign spend to an EV feature, price tier, or dealership message before knowing which buyer segment actually values it. A controlled experiment avoids this: compare the specific alternatives across precisely defined buyer segments and measure which one changes stated purchase choice, before the tooling order or campaign brief locks the choice in.
Why the decision matters
Adding a feature such as a heads-up display or a larger touchscreen costs millions in engineering, tooling, and validation, and removing it after the decision is committed is close to impossible. A price tier or dealership sales script is cheaper to change, but a wrong call still shows up as dealership friction and wasted launch messaging that a team only discovers after the vehicle or campaign ships.
The industry's model cycles used to make slow research acceptable. Annual brand tracking and multi-year product planning fit a world where a platform lasted roughly seven years between refreshes. That cadence is a poor match for a market where a competitor has changed pricing three times in a quarter and a new entrant can launch in an adjacent region with little warning.
What causes the outcome
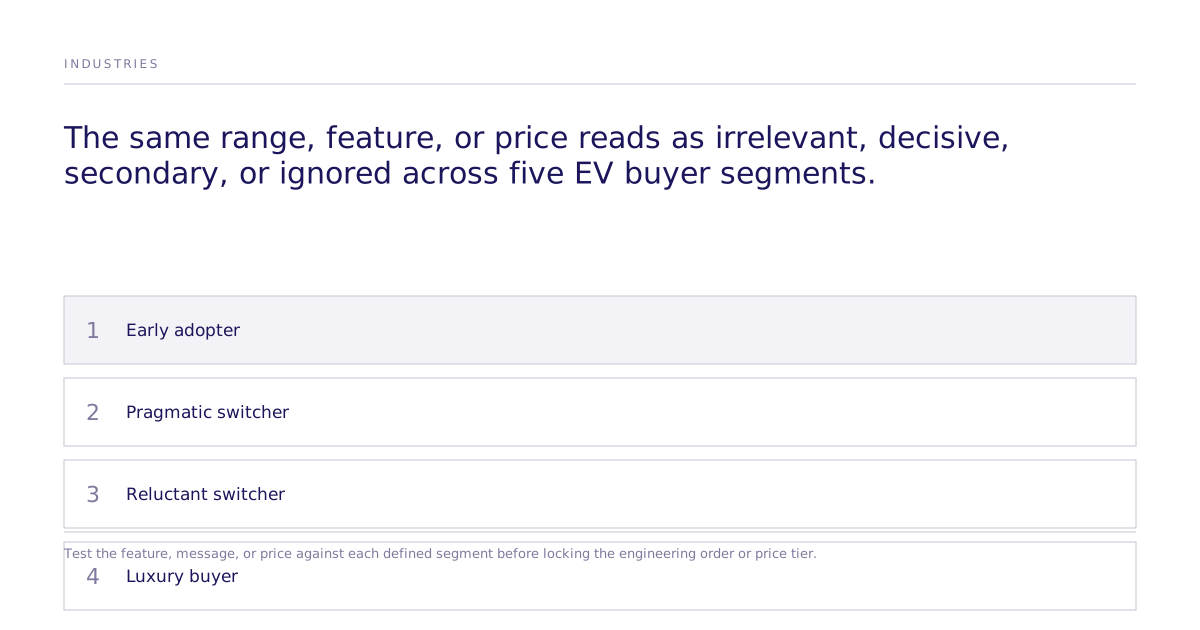
EV buyers are not one audience. At minimum, teams typically distinguish five behaviorally distinct groups: an early adopter who bought an EV in 2019 and is shopping for a second one, a pragmatic switcher moving because the total cost of ownership now works in their favor, a reluctant switcher pushed by regulation or a company car policy, a luxury buyer who weighs badge and status ahead of powertrain, and a holdout who is not close to converting. Each group can respond to the same range figure, feature, and price differently, and a single combined research sample tends to average these responses together, hiding the split that actually matters for the decision.
A controlled experiment is built to catch that failure mode. Instead of asking an open-ended question and summarizing what a mixed sample says, it holds the population's segment definitions fixed, changes one thing at a time, such as a HUD versus a larger touchscreen or a range framing versus a price framing, and estimates which segment's choice moves and by how much.
Evidence
A concrete range or price only means something in the context of who is being asked. A stated range of 500km reads as irrelevant to an early adopter who has already stopped thinking about range anxiety, decisive to a reluctant switcher who is still calculating commute margin, and secondary to a luxury buyer weighing the badge first. A price point near €80,000 clears a luxury buyer's threshold without hesitation while the same figure is compared, line by line, against a pragmatic switcher's current lease payment. These are illustrative examples, not a benchmark from any one study, but the same logic applies to any feature, message, or price point a team is testing.
A result that only reports "63% preferred option A" without a segment breakdown throws away the information that actually drives the roadmap or pricing decision.
Options and trade-offs
| Method | What it tests | Typical cycle time | Where it falls short |
|---|---|---|---|
| Annual brand tracking | Aggregate brand perception over time | Once a year | Reports a lagging snapshot; can't isolate which recent change moved perception |
| Vehicle clinics | Physical product reaction, ergonomics, first impression | Weeks to months per clinic | High-fidelity but expensive and infrequent; not built for rapid message or price iteration |
| Conjoint analysis / MaxDiff studies | Feature and price trade-offs across a fielded sample | Weeks per study | Rigorous but slow relative to how often pricing or feature decisions now need answers |
| Controlled discrete-choice experiment on a simulated market | A specific feature, message, or price alternative against a defined segment, with a causal effect and confidence interval | Minutes to hours once the population is defined | Does not replace physical clinics, observed dealership behavior, or engineering and safety review |
None of these methods is obsolete: clinics and observed dealership behavior remain the only way to confirm what happens when a real buyer sits in the vehicle or walks the sales floor, and conjoint and MaxDiff studies remain a rigorous standard for a one-time, high-stakes feature trade-off. The gap they share is speed relative to a market where a competitor's pricing or positioning can shift inside a single quarter.
Recommended decision process
- Name the exact decision: which feature, price tier, range framing, or dealership script is being chosen between.
- Define the buyer segments precisely enough that a result can be attributed to one segment and not another.
- Run a controlled comparison of the alternatives against those segments and report the causal effect on stated choice, with uncertainty, rather than a single average preference score.
- Treat the result as the first experimental pass, not the final word: confirm a consequential result with a vehicle clinic, an observed test-drive or dealership session, or an engineering and safety review before committing capital.
- Repeat the comparison as the market shifts, since a pricing or competitive move can change which alternative wins.
Where does Subconscious fit?
Subconscious runs controlled discrete-choice experiments on a simulation of a defined market to estimate which action, such as a specific EV feature, price tier, or dealership message, is most likely to change stated purchase choice for a given buyer segment, with a causal effect and confidence interval. The output is a comparison between named alternatives, not a summary of plausible opinions from a generated persona.
Subconscious can also test or validate a study with real human participants, which matters for a consequential decision like a feature investment: a team can move from the simulated comparison to a recruited human study without changing the underlying causal question. See current case evidence for how this has worked on pricing and go-to-market decisions in other categories, and book time to scope an automotive-specific comparison.
What are the limitations and failure conditions?
A controlled experiment on a simulated market still does not replace a physical vehicle clinic, an observed test-drive or in-dealership session, or an engineering and safety review. Nor is it a substitute for continuous, in-market brand tracking: a simulated experiment is not a panel of real people recruited on a recurring cadence, and a single comparison should not be read as an ongoing brand-monitoring product. The method works best when the decision is genuinely one alternative against another, with a defined buyer segment; it is a weaker fit for an exploratory, undefined question about how a market feels in general.
Adjacent questions
How many EV buyer segments should a team define before testing? Enough that a result can be attributed to a specific group's behavior rather than blended into a single average. Five is a common starting point (early adopter, pragmatic switcher, reluctant switcher, luxury buyer, holdout), but the right count depends on how differently those groups actually respond to the alternatives under test.
Does this replace dealership training or sales scripts? No. A controlled comparison can show which script framing changes a stated decision for a given segment, but confirming it works on the sales floor still requires observing an actual dealership interaction.