How to compare simulated and human experimental results
Compare simulated and human experiments only when they measure the same alternatives, population, and outcome. Then test whether both experiments rank the alternatives in a similar order. A high rank correlation supports agreement for that study. It does not prove universal accuracy.
This is the validation discipline behind Subconscious for ordering claims. A causal experiment earns weight by reproducing a human baseline's ordering under matched conditions, not by producing a plausible response; rank correlation does not validate effect magnitudes, attribute coefficients, WTP, or confidence-interval width.
Define the comparison before reading the result
The unit of comparison is a matched experiment. Subconscious can use the same intervention, choice set, target population, and measured outcome for simulated and recruited-human runs.
This distinction matters because a model can match an overall average while missing the ordering of alternatives or the response of an important segment. Validation should preserve the decision a buyer will make.
How was the human baseline established?
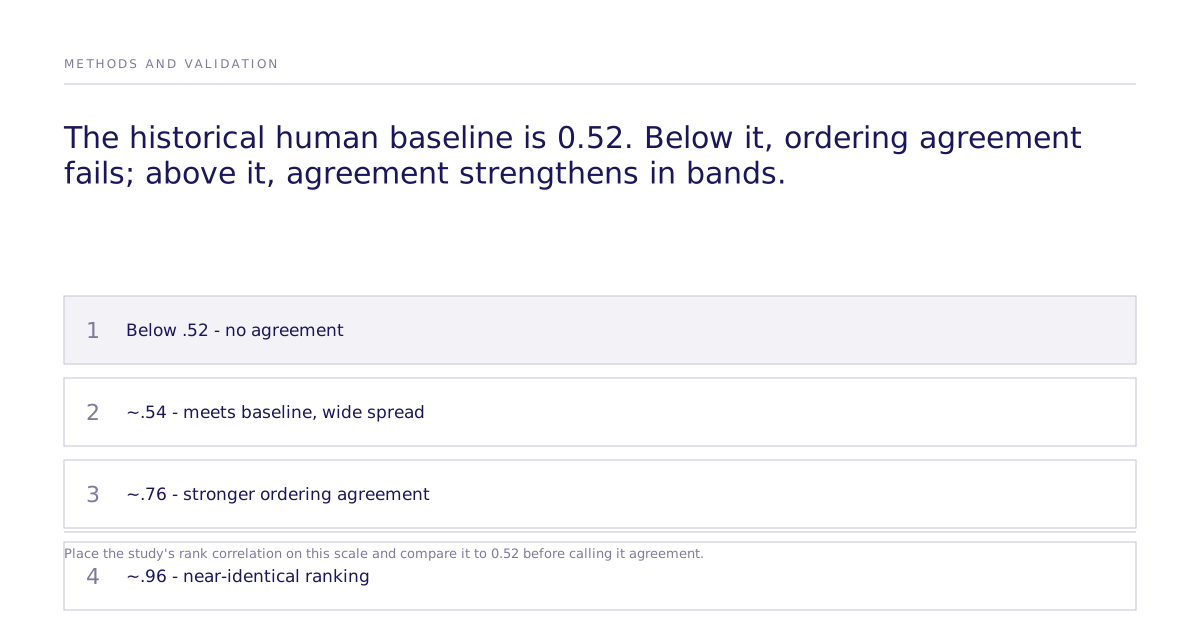
The historical method grouped responses from a published experiment with 25 levels into three subsets. Pairwise comparisons between the subsets produced Spearman rank correlations from 0.52 (p=.006) to 0.86 (p<.001). Publishing the baseline's own caveat keeps the threshold honest. The analysis used at least 0.52 as its within-human agreement baseline, though this subset-based estimate is likely attenuated relative to a full-sample comparison and should not be treated as symmetric with a full-sample simulation result.


The source used a rank correlation of at least 0.52 as this threshold. Rank correlation measures order agreement, not variance explained in the underlying decisions, so the threshold does not imply a percentage of variation explained. Keep that interpretation tied to the historical experiment. It is not a general product guarantee.
How do you read a rank-correlation chart?
Spearman rank correlation measures whether two result sets order alternatives similarly. The coefficient does not require the values to be identical.

This miss sits on the leaderboard next to the hits. A coefficient below .52 did not meet the historical baseline, though the p-value shown tests only whether the correlation differs from zero, not whether it reaches .52.

Naming the spread here is what lets a buyer check the claim. The .54 point estimate clears that study's threshold, but its confidence interval is wide enough to overlap much lower values, so the wide spread still matters.

The .76 result shows stronger agreement in ordering.

The .96 result shows very strong agreement for the compared experiment.
What can the comparison support?
A matched result can support a narrow claim: the simulated study recovered the ordering found in the human study under the tested conditions. It cannot show that every audience, intervention, or outcome will behave the same way.
Subconscious uses this distinction to separate a tested decision from synthetic roleplay. Agreement and disagreement both become useful evidence when the intervention, population, outcome, and comparison rule remain fixed. The company publishes a replication leaderboard so a buyer can inspect the human baseline, result, and failure condition rather than accept an unqualified accuracy claim.
Current replication claims belong with the causal fidelity paper, where the metric and evidence can be defined. They should not be derived from the historical 0.52 threshold on this page.
Use the counterfactual causal inference guide to see how model assumptions affect an estimated effect.
Limitations
A correlation number without its limits is marketing copy. Rank correlation does not measure calibration, individual-level fidelity, subgroup validity, or the cause of disagreement. A complete validation program should examine those questions separately and report failed replications as well as successful ones.
The charts and thresholds above describe a historical validation method. They require evidence review before publication as current Subconscious proof. The decision rule is narrow: report what replicated, what did not, and which conclusion the evidence can support.