How Key Driver Analysis identifies what matters most
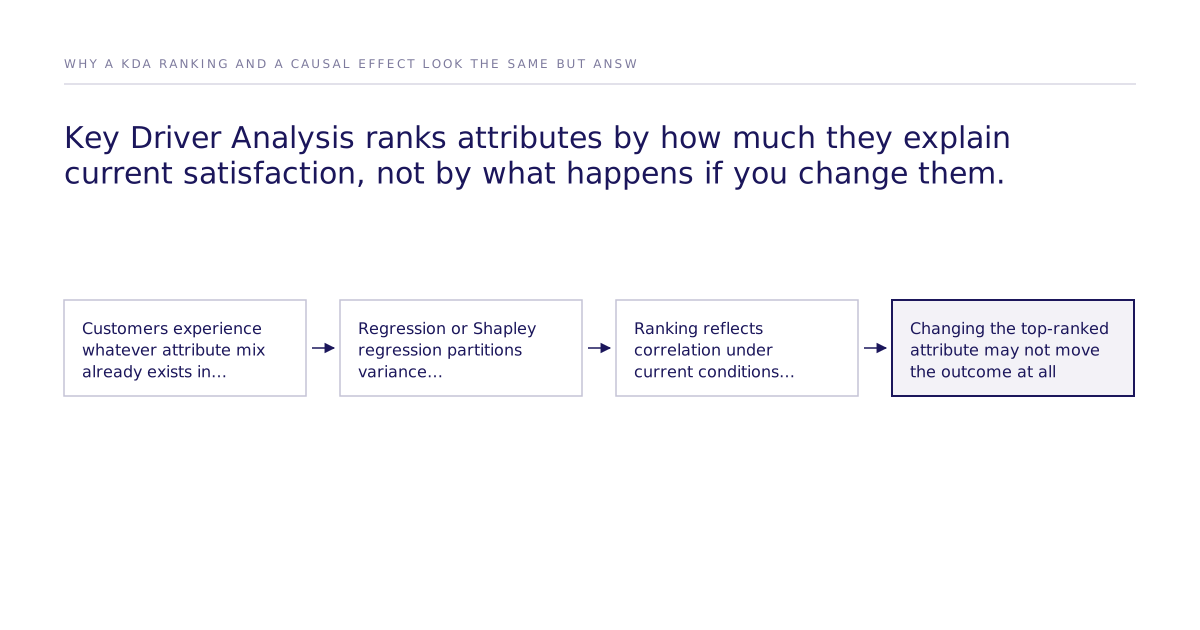
A CX or insights leader looking at a Key Driver Analysis report has to decide whether to spend next quarter's roadmap budget on whatever attribute sits at the top of the ranking. KDA answers that ranking question with regression or Shapley regression run on survey data you already collected: it scores each attribute by how much of the variance in an outcome like NPS or loyalty it explains among the customers who happened to answer your survey. That score tells you what already correlates with satisfaction in the market as it exists today, not what would happen to satisfaction if you changed one attribute and held everything else constant.
- Key Driver Analysis ranks survey attributes by their statistical association with an outcome, using multiple regression, relative importance analysis, or Shapley regression.
- Shapley regression fixes the coefficient instability caused by intercorrelated attributes, but it still runs on observational, cross-sectional data.
- A KDA ranking describes what explains satisfaction under the status quo. It cannot tell you what happens if you change an attribute, because nothing in the survey was manipulated.
- Randomized choice experiments, analyzed with discrete choice models such as McFadden's model, Mixed Logit, or ICLV, introduce controlled variation so an effect can be identified rather than inferred.
- A validated simulation protocol can reproduce the direction and outcome of real human studies at a measured rate, reported on the public leaderboard.
What does Key Driver Analysis actually measure?
KDA measures how much of an outcome's variance each attribute explains among customers who already lived through some mix of those attributes. In practice this means multiple regression, relative importance analysis, or Shapley Value regression run on a satisfaction or NPS survey. Shapley regression, the version most vendors now recommend, treats each attribute as a player in a cooperative game and assigns it credit equal to its weighted-average contribution to R² across every possible subset of attributes (Displayr). The output is a ranked list. Nothing about the underlying data changes: it is still a snapshot of customers who never experienced a controlled version of any attribute.
Why Shapley regression became the industry standard
Standard multiple regression breaks down when attribute ratings intercorrelate, and in satisfaction surveys they almost always do. Attributes routinely correlate above 0.80, the threshold generally flagged as dangerous for regression, which makes coefficients unstable and prone to flipping sign between runs (JumpData). Shapley regression was adopted specifically to stop that instability by distributing importance across correlated attributes rather than assigning it to whichever one happens to win the regression. It is a real fix for a real problem: unstable coefficients. It is not a fix for what the coefficients mean.
The fix that never touches the real problem
Shapley regression solves a computational problem, not a design problem. The data feeding it is still cross-sectional and observational: customers rated attributes as they already existed in the market, in whatever combination happened to occur. Nothing was assigned to them at random. Practitioners in the field have flagged this directly, arguing that KDA output is frequently over-interpreted as causal when it is fundamentally correlational, vulnerable to confounding and reverse causation regardless of which regression variant produced the ranking (Youssefnia, citing Scherbaum, Putka, Naidoo & Youssefnia, 2010). A stabilized coefficient is still a coefficient. It describes what varied together in your sample, not what would happen if you deliberately changed one thing and left the rest alone.
Stated importance vs. derived importance: a debate that misses the causal question
A parallel debate in CX research pits stated importance, asking customers directly what matters to them, against derived importance, inferring it from regression on their ratings. Comparative studies remain sparse and their results conflict, so neither camp has settled the question of which better predicts behavior. Both sides are arguing about a downstream detail. Whether you ask customers to rank attributes or infer the ranking statistically, you are still describing preferences within the status quo. Neither approach introduces a version of the market where one attribute changed and the rest held still, so neither can tell you what would happen if it did.
What can a randomized experiment tell you that Key Driver Analysis can't?
A randomized experiment can tell you what happens to the outcome when you actually change an attribute, because the attribute was assigned independently of everything else a respondent might bring to the choice. This is the distinction between backward-looking KDA, which explains satisfaction that already occurred, and forward-looking conjoint or discrete choice experiments (DCE), which predict what a future change would do. DCE, Mixed Logit, and ICLV are estimators, not causal methods in themselves; the causal identification comes from the randomized manipulation built into the experiment design, not from the statistical model fit to the results. That is why the accurate description is randomized experiments analyzed with discrete choice models, not "causal methods like DCE." Mixed Logit is also worth naming for a separate reason: it relaxes the independence of irrelevant alternatives (IIA) assumption baked into a flat multinomial logit, which matters if you plan to read preference-share or substitution results out of the model. A flat logit assumes adding or removing an alternative affects all other alternatives proportionally; real substitution patterns rarely behave that way.
How accurate is a simulated experiment compared to a real one?
Our best configuration reaches 87% of the measured human ceiling on one study: 0.832 rank correlation against the published human result, where two independent samples of real humans reach 0.959. Across all 43 studies that pass design filters the mean is 0.73, per the causal fidelity paper. That figure is a validation-set result, not a guarantee for a market you haven't tested yet, and it comes with a caveat worth stating plainly: some published human studies used for validation could theoretically overlap with a model's training data, which is exactly why a held-out replication protocol, rather than a single retrospective comparison, is the check that matters. Results across studies and categories are tracked on the public leaderboard, which is worth checking against the category closest to your own decision before you trust a number for it.
Key Driver Analysis vs. randomized choice experiments
| Key Driver Analysis (regression / Shapley) | Randomized choice experiment (DCE, Mixed Logit, ICLV) | |
|---|---|---|
| Data source | Cross-sectional survey of existing customers | Choice tasks with randomized attribute combinations |
| What it measures | Statistical association under the status quo | Effect of a controlled change on choice |
| Handles multicollinearity | Shapley regression stabilizes it | Not typically an issue; attributes are orthogonalized by design |
| Answers "what if we change X?" | No | Yes, within the tested attribute range |
| Confounding and reverse causation | Present and uncontrolled | Addressed by random assignment |
| Speed and cost | Fast, uses data you already have | Requires designing and fielding an experiment |
| Best for: | Diagnosing what already correlates with satisfaction in an existing survey, when the decision is low-stakes or exploratory | A real product, pricing, or messaging decision where you need to know what would happen if you acted |
Which method should you run for your next roadmap decision?
Run KDA when you already have survey data and want a quick, low-cost read on what correlates with satisfaction today; treat the output as a hypothesis generator, not a budget justification. Run a randomized choice experiment when the decision has real cost if you're wrong, a pricing change, a feature investment, a positioning shift, because that is the only design that tells you what happens if you actually change the attribute rather than what already happened to correlate with it. Case studies of teams using this second approach are on case studies.
Before committing budget to the top attribute in your next KDA report, check whether that attribute has ever been tested with a controlled change, in your own data or in a published experiment; if it hasn't, that's the gap a randomized experiment closes. When you want a second read on a specific decision, book time with our team.