Should You Trust a Raw Tracking-Poll Average? A Hierarchical Model Answers That
A raw tracking-poll average is not trustworthy on its own; a hierarchical model separates the real trend from pollster bias, method bias, and sampling noise, and only what remains after that separation deserves your trust. A tracking metric moved this month. Before a research or insights leader acts on that move, one question decides everything: is this a real change in the trend, or noise from which pollster ran the survey, which method they used, and how many people they sampled? Reading the raw average and reacting to it treats every source of noise as signal.
The decision this affects
Any team that watches a repeated measurement over time (approval, awareness, purchase intent, brand favorability) eventually has to decide whether a change is worth acting on. A raw average risks two mirror-image mistakes: treating noise as a real shift and moving a launch, price, or message in response to nothing, or dismissing a real shift as noise and missing the window to respond, because it never separates the latent trend from the biases and sampling error layered on top of it.
Why Does the Raw Average Mislead?
A public dataset of French presidential approval polls from 2002 to 2021, across ten pollsters and four survey methods (face-to-face, phone, internet, mixed phone-and-internet), shows monthly standard deviation that spikes well above what a single, stable trend would produce, particularly during one president's second term and the start of another's. Some of that variance is a real, if temporary, bump in approval after specific events. Some of it is not real at all: it is a property of which pollster asked and how.
A pollster-by-method breakdown of the same data shows the pattern: face-to-face polls report systematically lower approval than average; phone polls report slightly higher. Individual pollsters carry their own persistent lean independent of method. None of this is political bias. It is statistical bias: a sampling method or a house's weighting choices nudging a number in a consistent direction relative to the average across pollsters and methods, not relative to some independently known true value.
What Separates Signal From Noise?
The fix is to build the reporting biases explicitly into the estimate instead of averaging around them. Political scientists use the same hierarchical, dynamic estimation approach to recover latent public opinion from noisy survey series (Caughey and Warshaw, MIT/Political Analysis) and to pool polls with contextual information for dynamic forecasts (Political Analysis, Cambridge University Press).
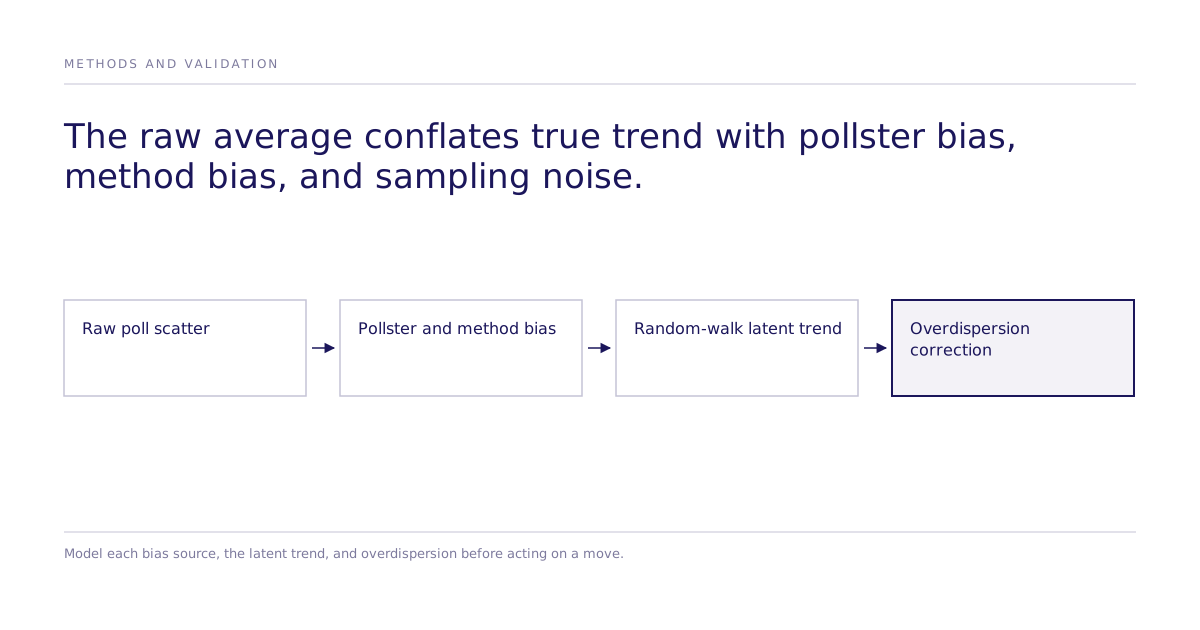
- Treat the true trend as a hidden (latent) state. The model never observes the "real" approval level directly, only noisy polls that are a function of it.
- Let that hidden state move as a random walk. Approval this month depends on approval last month plus some innovation, not on some independent draw each period.
- Give every (pollster, method) pair its own bias term. House effects are estimated from the data rather than assumed away.
- Model overdispersion explicitly. A random-walk-plus-bias model evaluated with a plain binomial likelihood still underestimates how much polls actually vary. A beta-binomial likelihood, adding one parameter to separate variance from the mean, closes much of that gap.
- Partially pool across groups instead of fully pooling or fully separating them. Treating every president's trend as identical understates real differences between terms; treating each term as fully independent throws away shared information. A hierarchical structure, where each president's trend is drawn toward a common trend but free to deviate, does both jobs.
- Constrain the bias terms. A free intercept alongside free house effects does not resolve the ambiguity between the trend's level and the average reporting bias; a sum-to-zero constraint, a reference pollster, or an informative prior on the house effects does.
The published version of the model, correctly parameterized, tracks each president's approval trajectory through its natural cycles and recovers plausible pollster- and method-level bias estimates relative to the average across pollsters and methods: face-to-face confirmed low, phone confirmed slightly high, and individual pollster leans consistent with what a practitioner who collects these polls by hand already expected.
How Does This Differ From a Controlled Experiment?
The model above estimates a hidden state from repeated observational measurements. It never intervenes on anything. It answers "what is the true trend, net of measurement noise and reporting bias?" for an outcome that already happened.
That is a different question from "which action caused the outcome to change?" A causal experiment requires a treatment, a comparison condition, and random assignment; a random-walk smoothing model requires none of those and cannot answer it no matter how well it fits. Subconscious sits on the causal side of that line: Subconscious runs randomized experiments on a simulation of your market, validated against real human behavior, to identify which action drives an outcome, reporting effect sizes with confidence intervals that quantify sampling variability within the simulation, not simulator-to-human bias, from repeated controlled measurement rather than a single point estimate. Our best configuration reaches 87% of the measured human ceiling on one study: 0.832 rank correlation against the published human result, where two independent samples of real humans reach 0.959. Across all 43 studies that pass design filters the mean is 0.73. See the causal fidelity paper. It is a validation result, not a guarantee for a new market.
The shared discipline is not the method. It is the refusal to read a single number at face value: both approaches insist on quantifying uncertainty and separating a real effect from an artifact of how the data was collected.
What this means for evaluating any tracked metric
| Question to ask about a tracked metric | What a raw average tells you | What a bias-and-noise-corrected estimate tells you |
|---|---|---|
| Did the trend actually move, or did the source mix change? | No: a shift in which pollsters ran this wave looks identical to a real move | Yes: house effects are held constant, so a shift in source mix does not masquerade as a trend change |
| How much sampling noise is baked into this month's number? | Not quantified | Explicit variance from overdispersion and sample size |
| Is one pollster or method systematically pulling the number in a direction? | Invisible unless checked by hand | Estimated directly, with uncertainty |
| Should we act on this month's number alone? | Tempting to, and often wrong | The model reports a range, not a point, making overreaction less likely |
A tracked number that does not separate a real trend from house effects and sampling noise cannot answer whether it is safe to act on.
Limitations
A number without its limits is a marketing claim. Noise correction like this answers a narrower question. It tells you what the underlying trend probably is, given the measurements you already have; it says nothing about what would happen under a different action, price, or message, because it never varies the conditions the data was collected under. A team that needs to know whether a specific intervention moves an outcome needs a controlled experiment, not a smoother trend line. Even a well-specified hierarchical model inherits the limits of its inputs: retrodictive checks in the source model show it still underestimates sharp swings from real-world events.
Naming where a method stops is what lets a buyer check it before they rely on it. Method boundaries also matter when validating against real people. Subconscious can test or validate studies with real human participants, letting a team move from a simulated causal experiment to real-human validation without changing the causal question. That step confirms an experiment's result against real behavior; it does not turn a random-walk trend estimate into a causal test, and does not substitute for one.
Next step
If the underlying question is which action actually changes the outcome, that calls for a controlled experiment, not a smoother read of an existing trend. See how a causal experiment differs from an observational read of the same market, or look at published replication results for a sense of how closely simulated experiments track real human behavior.