Case Study: Willingness to Pay For Ingredients
A packaged-food pricing lead needs one number before approving a clean-label launch price: how much extra shoppers will actually pay for the claim. Not what they said in a survey. That number belongs in a pricing model only after it's been checked against real purchase behavior and carries a confidence interval, not when it's a single conjoint run handed straight to finance. Most published ingredient-claim studies skip that check.
- Ingredient-claim WTP studies (clean label, organic, free-range, functional claims) are usually run once as a conjoint or discrete choice experiment, and the point estimate gets reported as the price a brand can charge.
- Stated WTP runs high: a meta-analysis of 28 stated-preference studies found a median hypothetical-to-actual ratio of 1.35, meaning real buyers typically pay less than survey respondents claim they will (Murphy et al., Environmental and Resource Economics).
- Published examples show the spread this creates: clean-label yogurt WTP of $2.54 to $3.53 per 32oz unit (PMC), free-range poultry premiums of 43 to 93 percent depending on category (DCE food research review), and organic/natural premiums that shift with what information respondents saw right before the choice task (Wallace & Huffman).
- A number without its limits attached reads as marketing. A WTP number becomes a pricing input only after it's checked against real behavior and scored with a confidence interval. On the leaderboard, our best configuration reaches 87% of the measured human ceiling on one study (0.832 rank correlation against the published human result, where two independent human samples reach 0.959), with a mean of 0.73 across the 43 studies passing design filters: a validation result, not a guarantee for any new market or claim (the causal fidelity paper).
- The buyer's action before approving a premium: ask what the estimate was validated against, not how large the sample was.
The decision: pricing an ingredient claim before you commit to it
The decision a pricing lead owns here is narrow and expensive: approve a premium on a reformulation or launch based on a WTP figure, or send the study back for validation first. Getting it wrong in either direction costs money. Either a launch priced below what the market would bear, or a claim that never earns back the reformulation spend because the premium was never real. Ingredient-claim WTP studies are one of the most common applied uses of discrete choice research in food, almost always run to justify a price move before it happens. Trust the study that was checked against purchase data, not the one with the largest sample size. See more examples in the case studies hub.
What the standard ingredient-claim case study measures
The conventional version of this study runs a conjoint or DCE panel once, estimates a per-unit dollar premium for the claim, and reports it as the price the brand can charge. A 2021 mixed-logit study on 250 yogurt consumers is a representative example: clean labeling was worth $2.54 to $3.53 per 32oz unit, and it also reduced the choice penalty consumers assigned to poor texture relative to longer-ingredient-list yogurts (PMC). Belgian DCE work on free-range poultry found premiums ranging from 43 to 93 percent depending on the product category, a wide enough band that picking the wrong end of it changes the launch math (DCE food research review). Wallace and Huffman studied natural, organic, and conventional foods. Premiums moved materially depending on which information treatment respondents saw right before the choice task (Wallace & Huffman). Conventional write-ups tend to bury that detail under model-fit statistics.
Why does a one-shot conjoint overstate what shoppers will pay?
A one-shot conjoint overstates WTP because stated preference is not the same behavior as spending real money. The gap runs in a known direction: stated WTP typically runs high, at a median ratio of 1.35 to actual spending (Murphy et al., Environmental and Resource Economics). Add the Wallace-Huffman finding that premiums shift with the information respondents saw right before the choice task, and a single conjoint fielding isn't measuring a stable number. It's measuring a framing-sensitive snapshot. The estimators used to produce it (McFadden discrete choice, Mixed Logit, ICLV) recover preference structure from that snapshot. They aren't causal methods themselves. The causal claim has to come from a randomized manipulation inside the experiment design, not from the estimator's model fit.
| One-shot conjoint or DCE panel | Validated randomized experiment | |
|---|---|---|
| What's measured | Stated preference from a single conjoint or DCE fielding | Randomized experiments analyzed with discrete choice models (McFadden DCE, Mixed Logit, ICLV), then checked against real behavior |
| Bias direction | Stated WTP typically runs high, median stated-to-actual ratio of 1.35 across 28 studies ([Murphy et al.](https://link.springer.com/article/10.1007/s10640-004-3332-z)) | Same estimators, but the resulting number is scored against a human holdout before it's used |
| Check against real behavior | None; sample size or model fit is offered as proof instead | Replication scored against the published human result and a measured human-to-human ceiling, per [the causal fidelity paper](https://fidelity.subconscious.ai/papers/causal-fidelity/causal_fidelity_paper.pdf) |
| Confidence interval | Rarely reported; when present, bounds sampling error only, not hypothetical bias | Reported, and scoped to the simulated population, not an unconditional bound on the real market |
| Best for | A first-pass read on which claims are worth testing further | A number that's about to be attached to a P&L line |
How does a WTP number get checked before it reaches pricing?
It gets checked by running the estimate through a replication step against real human behavior and attaching a confidence interval, not by reporting the point estimate alone. The chain has enough steps that it's easy to compress into "we validated it" without saying what that means, so it's worth laying out in full.
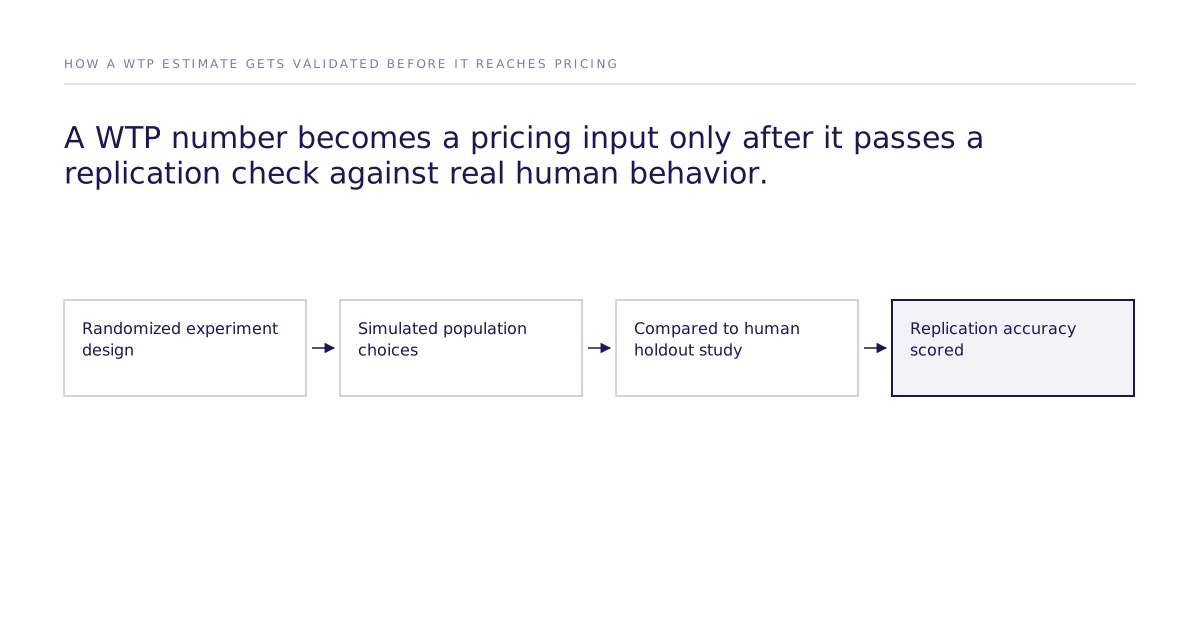
Replication, in the sense the leaderboard tracks it, is scored against the published human result and a measured human-to-human ceiling: the best configuration reaches 87% of that ceiling on one study (0.832 against a 0.959 ceiling), with a mean of 0.73 across the 43 studies passing design filters. That is a validation result, not a guarantee that any new market or claim will replicate at that rate (the causal fidelity paper). Naming a failure mode is what lets a buyer check it before relying on the number. Published human studies can sit inside a model's training data, which would make a replication look stronger than it is. The replication protocol is built to test against that risk, but the risk itself doesn't disappear because a protocol exists to check for it.
What does the confidence interval actually cover?
The scope of a confidence interval is worth stating plainly so a buyer can check it before using the number. It covers the effect within the simulated population the study was run on, not the real market unconditionally. A confidence interval attached to a simulated experiment tells a pricing lead how much the estimate would vary if the simulated study were repeated, given the population and design used. It doesn't extend that guarantee to shoppers who weren't represented in the design. It doesn't correct for hypothetical bias on its own, either. That requires an incentive-aligned design or a validation step against real behavior, a separate check from the interval itself.
Does the premium hold up when claims compete on the same shelf?
A pricing lead needs to see a modeling limit next to the claim it affects. Only if the model used to estimate substitution accounts for it, which a flat multinomial logit does not do well. A standard logit model carries the independence of irrelevant alternatives (IIA) assumption, which implies that adding a new competing claim (say, a free-range option next to a clean-label one) pulls share from every existing option in fixed proportion, a pattern real shelves rarely follow. Mixed Logit relaxes that assumption by allowing preferences to vary across the simulated population, which is part of why it shows up in the yogurt and food-research work cited above, but relaxing IIA is not the same as validating the resulting share estimate against real substitution behavior. Any preference-share or substitution claim built on a flat logit needs the IIA assumption named next to it, not left implicit in the model choice.
What should a pricing lead ask for before approving a premium?
Ask for the validation source, the confidence interval, and the bias direction before the sample size. Concretely: was the WTP estimate checked against a real-behavior holdout, or only reported off the conjoint itself? What does the confidence interval cover, the simulated population or a claimed bound on the real market? Was the design incentive-aligned, or does the number need a hypothetical-bias discount before it goes into the P&L? And if the study compares multiple claims on the same shelf, was substitution modeled with an approach that accounts for IIA, or with a flat logit that assumes it away? A study that answers all four without hedging is a decision input. One that answers none of them is a survey artifact dressed as one.
Before approving a premium, pull the confidence interval and the validation source for any WTP number your team has been handed. Check whether the design controlled for information order the way the Wallace-Huffman work flagged. To talk through how a validated ingredient-claim study gets built, reach the team.