One Oil Forecast, Five Independent Models: A Case Study in Trusting a Number
A procurement team whose costs track crude oil faces a binary choice: lock in supply now at an elevated price, or wait for the market to normalize. Locking in early wastes money if prices fall. Waiting too long means paying the premium for longer, or missing the window entirely. Either mistake is expensive, and a single model's point forecast hides exactly the disagreement a buyer needs to see before committing.
The setup: a price above its normal range
WTI crude (the benchmark price for U.S. crude oil futures) was trading at $90.54 per barrel, roughly a third above the $68.26 threshold defined as "normal." That threshold marks the top quartile of where WTI sat across all of 2025: a year in which the price moved within a $55-to-$80 band and averaged $64.74. The question a procurement team needs answered isn't "will oil come down," it's "what is the probability it comes down within three months, six months, a year, and how much should that probability change a purchasing plan."
The U.S. Energy Information Administration publishes its own probabilistic WTI outlook on a comparable cadence, which is the kind of independent benchmark a team should check any internal forecast against rather than trusting a single pipeline in isolation (EIA Short-Term Energy Outlook).
"We now forecast the Brent crude oil spot price to average around $85 per barrel (b) in the third quarter of 2026 (3Q26)."
U.S. Energy Information Administration, Short-Term Energy Outlook (source)
Five forecasters, one dataset, no coordination
Rather than fit one model and report one number, the analysts calibrated five independent Bayesian forecasting models on 19 years of daily WTI price history (2007–2026, 4,744 observations), plus four supplementary series as optional context: an oil volatility index, the S&P 500, three Asian equity indices, and a group of shipping and energy-transport stocks. Each forecaster chose its own statistical method from a library of ten time-to-event techniques (survival models, regime-switching, jump-diffusion, and others) without seeing the others' work, then a separate reviewing pass compared the five outputs, scored them on convergence diagnostics and internal consistency, and selected the best-calibrated one as the headline.
That structure matters more than the specific numbers. If five differently-configured analysts independently reach the same answer, it's more likely to reflect the data than an arbitrary modeling choice. If they disagree, the disagreement itself is information: it shows a buyer where the uncertainty lives instead of hiding it behind one confident number.
What did the five forecasters find?
All five independently picked the same backbone method: mean-reversion, the idea that a price stretched away from its long-run equilibrium tends to drift back toward it. They split only on whether to add explicit jumps (sudden, discrete price moves like an OPEC announcement or a demand shock) on top of that backbone. Two forecasters used pure mean-reversion; three added jumps to account for fatter tails in the historical data.
| Instance | Method | P(normalized, 3 mo) | P(normalized, 6 mo) | P(normalized, 12 mo) | Median days to threshold |
|---|---|---|---|---|---|
| #1 (headline) | Mean-reversion | 23.3% | 44.5% | 65.9% | 88 |
| #2 | Mean-reversion + jumps | 18.7% | 34.4% | 49.1% | 87 |
| #3 | Mean-reversion + jumps | 19.1% | 34.7% | 50.0% | 88 |
| #4 | Mean-reversion | 23.2% | 44.4% | 66.2% | 89 |
| #5 | Mean-reversion + jumps | 19.1% | 34.6% | 49.9% | 88 |
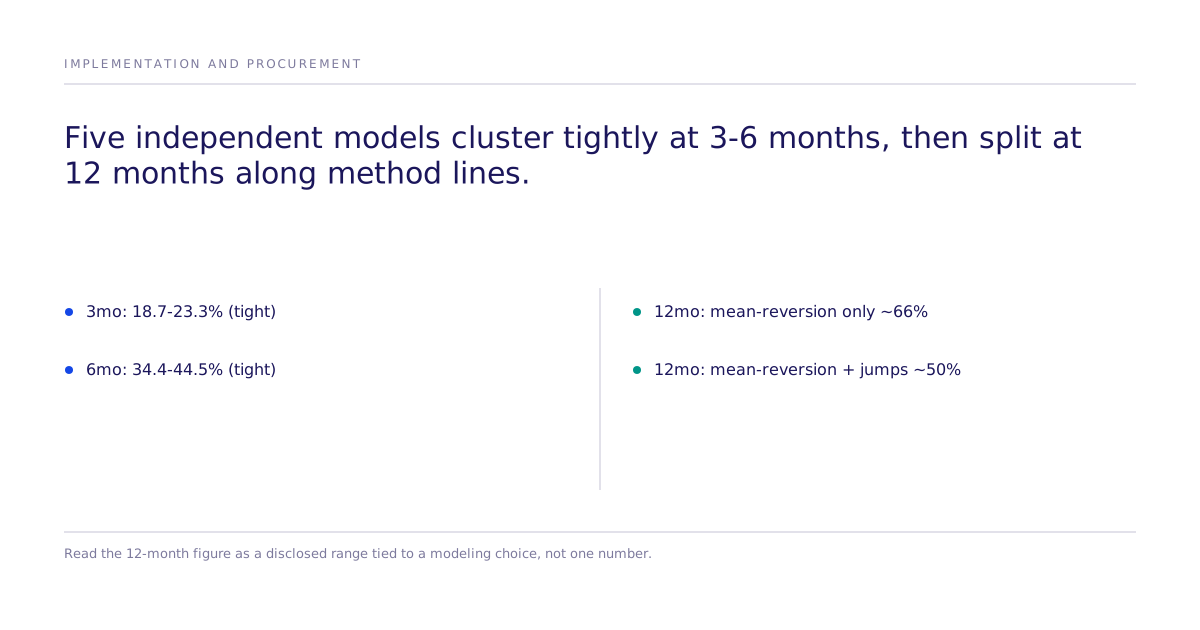
Near-term estimates cluster tightly: at three months the five forecasters range from 18.7% to 23.3%, a narrow spread relative to each individual model's own credible interval. At twelve months the spread widens and splits along method lines: the two pure mean-reversion models land near 66%, the three jump-diffusion models near 49 to 50%. That gap is a real, disclosed disagreement about whether today's elevated price is a transient spike or evidence of fatter-tailed risk.
Checking the forecast against what actually happened
A forecast is only as trustworthy as its track record on data it wasn't fit to. The headline model was validated with time-slice cross-validation: refit on an earlier window, then checked against what prices actually did afterward. Its 94% credible bands covered 74% of the held-out six-month slice, 99% of the twelve-month slice, and 100% of the twenty-four-month slice.
The twelve- and twenty-four-month results are well-calibrated. The six-month under-coverage is an honest signal that the model understates near-term volatility, which means the near-term probabilities in this analysis are best read as lower bounds, not final answers.
What it means for a procurement decision
Near-term normalization is unlikely, and all five forecasters agree on that. Put a number on it: the odds sit near 77% that WTI hasn't dropped back under $68.26 by early September, so a team needing supply within about three months is mostly buying insurance by waiting. At six to twelve months the picture is genuinely balanced: close to a coin flip by six months (44%), tilting toward normalization by twelve months (66% under the mean-reversion view, closer to 49% under the jump-diffusion view). Staging purchases at trigger prices, buying more as the price crosses successive thresholds, captures early normalization while hedging the chance prices stay elevated through the year.
What are the limits of this analysis?
Five forecasters sharing one prompt, one method library, and one underlying model family is weaker evidence of robustness than five genuinely independent teams working in isolation. The agreement here rules out a single unlucky configuration, not every source of correlated error. The $68.26 threshold is anchored to a single calm year and sits close to the model's own fitted long-run equilibrium (~$70), which is why the long-horizon odds look as high as they do; a different definition of "normal" would move that number. And the models see only price and volatility history: an OPEC decision, a supply disruption, and a drop in demand all look identical to the model, so it can't tell which is behind the current elevation, only that price jumps of this size have historically reverted.
None of this establishes a forecasting capability for commodity prices, and it isn't one. What it demonstrates is a discipline worth borrowing for any consequential business decision built on a single model's output: run more than one credible method, disclose where they agree and where they don't, and check the result against data the model never saw.
Where does this discipline apply to customer behavior?
Subconscious.ai applies the same discipline of multiple independent methods, disclosed disagreement, and out-of-sample checking to a different class of decision: not a commodity-price forecast, but whether a specific pricing or positioning change moves buyer behavior, tested as a controlled causal experiment with a confidence interval attached to the answer rather than a single number.
Teams that need a causal answer, not a market forecast, can move that same experiment design from a simulated study to real-human validation without changing the underlying question, then bring the results into their own case studies.
Full detail on the forecast methodology, including the historical calibration window and each forecaster's method selection, is available from the EIA's published WTI price comparisons.