Predicting Swinging Strikes with Bayesian Additive Regression Trees
Bayesian additive regression trees predict swinging strikes by summing many shallow trees fit through MCMC sampling over pitch-tracking features like velocity and spin rate, producing a whiff probability with a credible interval attached. A model that returns one number is asking for trust it hasn't earned. It earns that trust with an uncertainty band, checked against data the model never saw. A worked example from baseball pitch-tracking data shows what that check looks like and why a decision-maker should demand it before any go/no-go call.
The decision this example stands in for
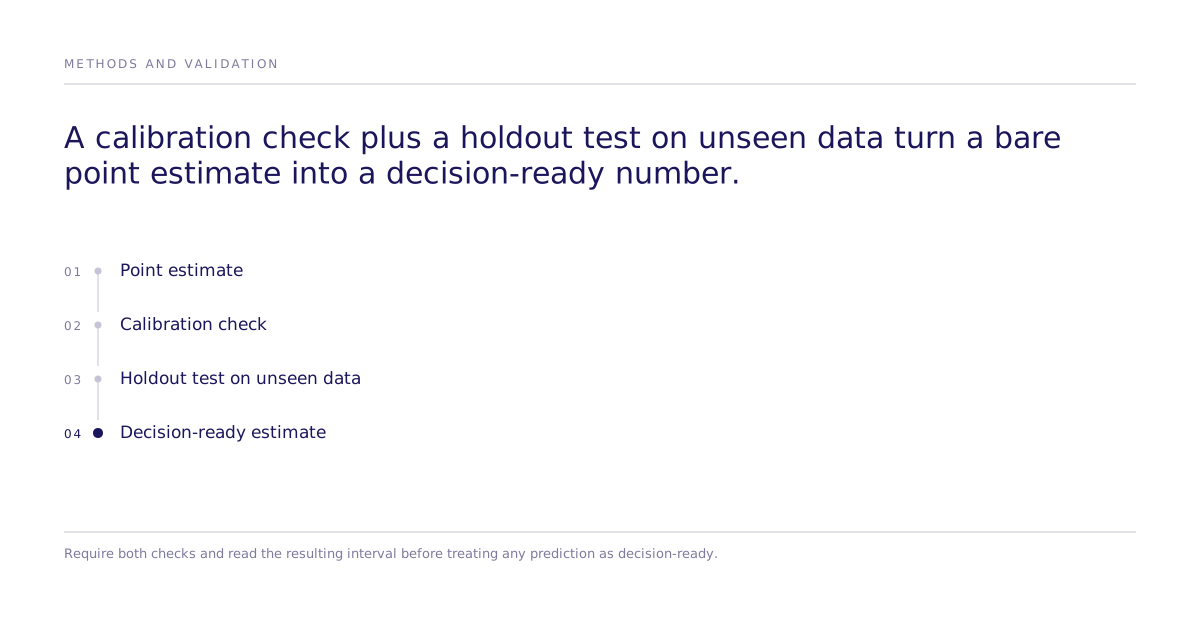
Approving a launch, a price change, or a messaging shift on a model's output means trusting that output's error range, whether the model states one or not. A point estimate with no stated uncertainty hides risk: if the real result lands outside the range nobody wrote down, the team has no record of how much uncertainty it ignored to get there. The fix is a habit of checking calibration and holdout performance before treating any number as decision-ready.
A worked example: predicting swinging strikes
The pitch-quality problem in baseball illustrates the check cleanly because the raw data is public and dense. MLB's Statcast system, using Hawk-Eye cameras installed in all 30 ballparks, captures velocity, spin rate, movement, and release-point geometry for every pitch thrown. The pybaseball library turns that into a single function call returning roughly 700,000 pitch-level observations per season with over 90 tracked columns.
The target: whiff rate, the share of swung-at pitches a batter misses, removes take decisions from the denominator, leaving a measure that still reflects which pitches batters chose to swing at. Four physical features, standardized to z-scores, form the baseline model:
| Feature | Description |
|---|---|
| Velocity | How fast the ball is traveling the instant it leaves the pitcher's hand |
| Vertical Break | Vertical deviation the spin imparts on the pitch's flight |
| Horizontal Break | Side-to-side drift toward the arm side or the glove side |
| Spin Rate | The ball's total rotation speed, measured in RPM |
These relationships are non-monotonic: a 98 mph fastball with elite backspin plays differently than the same spin on a 91 mph pitch, and tree-based models capture that interaction where linear models can't.
Why use a Bayesian additive regression tree instead of a gradient-boosted tree?
Gradient-boosted trees such as XGBoost dominate pitch-quality modeling, but they build through sequential greedy optimization and return a single point prediction; getting an error bar out of them requires bootstrap or conformal add-ons. A Bayesian additive regression tree (BART), introduced by Chipman, George, and McCulloch in BART: Bayesian additive regression trees (The Annals of Applied Statistics, 2010), builds trees through MCMC sampling from a posterior instead, so every prediction ships with a full distribution and a built-in credible interval.
| Aspect | XGBoost | BART |
|---|---|---|
| Tree construction | Grows trees one at a time via greedy, sequential optimization | Draws trees by MCMC sampling from a posterior |
| Regularization | Explicit penalties on depth, leaf count, and λ | Implicit, enforced through priors over tree shape |
| Output | A single point prediction | A full posterior distribution |
| Uncertainty | Needs a bootstrap or conformal add-on to estimate | Comes with credible intervals already built in |
BART's tree-structure prior favors shallow trees: the probability that a node at depth d splits follows
P(\text{split at depth } d) = \frac{\alpha}{(1 + d)^{\beta}}With the library's default values (α = 0.95, β = 2), a depth-0 node splits with 95% probability, but a depth-2 node splits only about 10% of the time, an implicit brake against the overfitting that plagues greedy tree growth. This BART variant, implemented within the PyMC probabilistic-programming framework, combines a specialized particle Gibbs sampler for the tree component with standard gradient-based samplers for any linear pieces in the same model, such as venue-level random effects.
The check that actually matters: calibration, then holdout
Fitting the model is the easy half. The example runs two checks before trusting the output:
Calibration. Pitches the model assigns a 10% whiff probability should whiff about 10% of the time in the data. A calibration report that only shows the hits is marketing copy. The baseline model calibrated reasonably well across most of its range, with visible deviation only at the extreme high end, where small sample sizes make any estimate noisy.
Holdout generalization. Twenty pitchers were held out of training entirely and scored only afterward. The holdout result belongs on the record next to the training result, misses included. Calibration on that unseen set showed some deviation in small-sample bins and mild underprediction at low whiff rates, but held up well enough overall to indicate the model captured real pitch quality rather than memorizing quirks of the pitchers it trained on.
Neither check is optional for a model whose output will drive a decision. A model that calibrates well on its own training data but has never been scored against holdout cases has only proven it can describe the past.
Adding features changes the uncertainty, not just the number
A second version of the model added release-point features (height, side, extension), an aerodynamic proxy called axis differential, a same-handed-matchup indicator, and venue-level random effects, growing from 100 to 150 trees. Comparing the two models by Widely Applicable Information Criterion, a Bayesian estimate of out-of-sample predictive accuracy that avoids running full cross-validation, showed the richer model with a better (lower) WAIC than the simpler one, though WAIC estimates leave-one-observation-out accuracy for the pitchers and venues already in the data, not generalization to new pitchers, and can be unreliable for hierarchical models with influential observations.
The enhanced model's uncertainty bands were wider than the baseline's, on the same pitchers. That's not necessarily the model performing worse: added variance components, weaker per-parameter identification, and more trees can widen posterior intervals on their own, and the widening may also reflect genuine execution variability, such as a pitcher's release height or extension shifting from throw to throw. A model reporting a narrower interval than the data justifies is the riskier of the two, not the more admirable one.
What this means for evaluating a causal-experimentation vendor
The specific numbers in this example (baseline calibration quality, the WAIC improvement from adding features, any pitcher-level leaderboard) describe a public baseball dataset, not a Subconscious result, benchmark, or case study. What transfers is the standard: a claim that a predictive model is trustworthy should come with a calibration check and a holdout test against cases the model didn't see; a causal treatment effect requires separate identification evidence, since counterfactual outcomes are never observed to check against, not a single number asserted with confidence.
Subconscious's stated approach to causal experimentation follows the same discipline: quantify uncertainty where the evidence supports it, and where relevant, validate a simulated result against real human participants without changing the underlying causal question being asked. See how the method works and current results on the leaderboard.
Where does this method not apply?
Naming a method's edge is what lets a buyer check it against their own case. Checking calibration and holdout performance validates that a predictive model's point-probability estimates are honest; it does not by itself establish that its credible intervals have correct coverage. It does not turn a simulated causal-effect estimate into an observed usability session, a clinical trial, or automatic proof that a decision will perform in the real market. Real-human validation, when used, confirms a causal question against real respondents; it's a separate step from the calibration discipline described here, not a replacement for it.
The question to ask before trusting a number
Before a launch, pricing, or messaging decision rests on a model's output, ask two things: has this been checked for calibration, and has it been tested on cases the model never saw. A vendor, or a method, that can't answer both is asking for trust on a point estimate alone.