Quantify the Uncertainty Before You Pick a Risk Policy
A planner who commits capacity, budget, or inventory against a single-number forecast is committing to a guess about the future. The forecast is usually close. The cost shows up when it isn't, and the plan has no built-in answer for how to absorb the miss.
The forecast that hides a decision
A point forecast (one number for expected demand) throws away the shape of the uncertainty around it. A Bayesian model instead produces a full distribution of plausible outcomes: a range of scenarios, each with a probability attached, rather than one estimate treated as fact. PyMC is one open-source tool built for this: it samples a distribution of parameters and forecasts, using an MCMC algorithm to explore the range of outcomes consistent with the data.
That distribution only pays off once it feeds a decision. A worked example: a planner forecasting daily demand for a resource over a multi-month horizon can generate thousands of posterior scenarios per period, then hand that full set of scenarios, not just a mean, into an optimization model. A commercial solver such as FICO Xpress is one tool built to take that scenario set and turn it into a generation or allocation plan under an explicit risk policy, rather than a plan built against a single expected value.
Two ways to turn a distribution into a policy
Once uncertainty is quantified, a planner still has to choose how to use it. Two approaches are common, and they answer different questions:
- A chance-constrained policy caps how often the plan is allowed to fall short of demand. In the worked example, the plan is required to cover the 95th percentile of forecast demand each day, meaning the plan is undersized in roughly 5% of scenarios.
- A conditional value-at-risk (CVaR) policy instead caps how severe the worst shortfalls are allowed to be. It works directly with the full scenario set, identifies the worst-case tail (the paper below uses the worst 5% of outcomes), and penalizes the average severity of shortfalls within that tail. The formulation used in this example is the Rockafellar-Uryasev model, published as "Optimization of Conditional Value-at-Risk" in The Journal of Risk (2000). It stays popular in practice because it is convex and often reducible to a linear program.
Neither policy is more correct in the abstract. A regulator that requires demand to be met 99% of the time is describing a chance constraint. A planner reasoning about the dollar cost of a bad tail outcome is reasoning in CVaR terms.
What does a stricter guarantee cost?
Moving from one policy to the other has a price in the worked example, though the two runs also differ in risk stringency (a 5% chance constraint versus a 0.35% realized shortage), so the comparison doesn't isolate the cost of the CVaR formulation alone.
| Metric | Chance-Constrained Policy | CVaR Policy |
|---|---|---|
| Average generation | 461 GWh/day | 500 GWh/day |
| Shortage risk | 5.00% | 0.35% |
| Total cost | Baseline | About 22% higher |
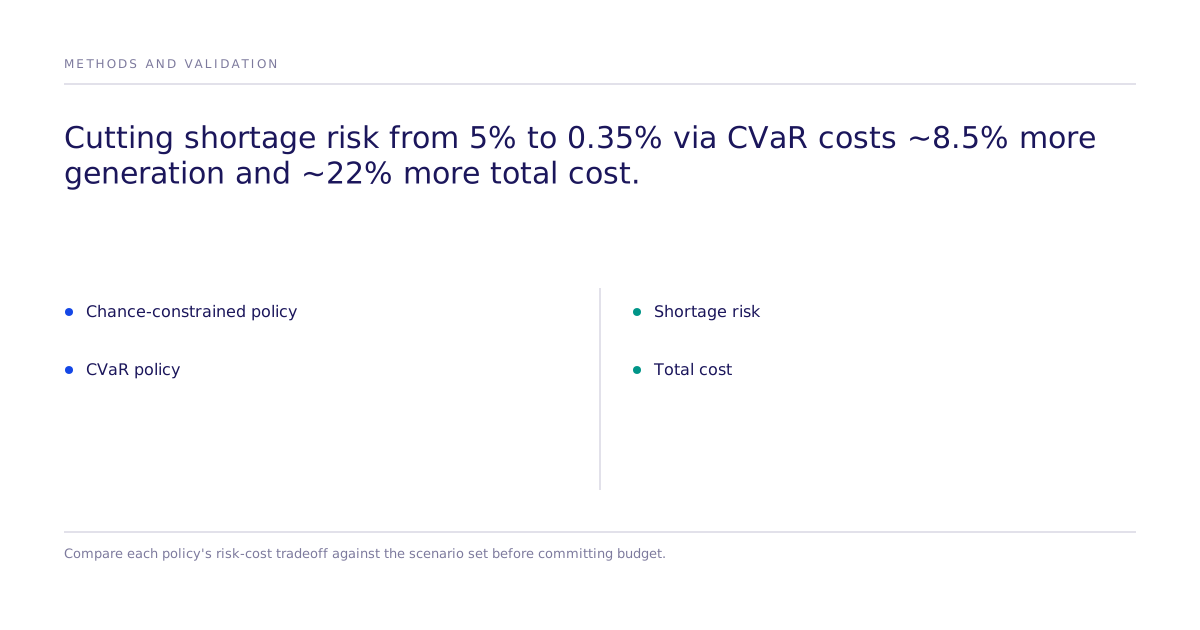
Cutting shortage risk from 5% to 0.35% required roughly 8.5% more average generation and raised total cost by about 22%, though that delta reflects both the change in policy form and the tighter risk target together. In a related sweep of the same model, varying the risk weighting and a separate clean-energy policy from 80% to 90% of generation, tightening the policy floored the best achievable shortage rate at 5.36% and added roughly $440M in cost, because a stricter side constraint became the binding limit on how much tail risk could be removed at any price.
The tradeoff was visible before a dollar was committed, because the forecast carried its own uncertainty into the optimization step instead of being collapsed into one number first.
Does this same pattern apply to go-to-market spending?
The decision pattern generalizes past power generation: quantify the range of plausible outcomes for an action, then choose an explicit policy for how much risk that range implies, before committing budget. Subconscious applies that same discipline to product, pricing, messaging, and go-to-market decisions. It tests an action with causal experimentation and discrete-choice-style modeling, producing parameter uncertainty on choice probabilities and stated WTP conditional on the experimental design, attribute set, and respondent pool, rather than committing capital on a single-point estimate of buyer response or relying on generic synthetic-user roleplay. Those intervals aren't a calibrated predictive distribution over realized market outcomes: stated WTP runs high before accounting for hypothetical bias, and applying a chance-constraint or CVaR policy directly to them would understate the true uncertainty.
That fit has a boundary. Subconscious does not provide mathematical optimization solvers, does not solve linear or mixed-integer programs, and does not run power-grid, supply-chain, or capacity-planning optimization. Teams that need the solver step still need a tool built for that job. How Subconscious works covers the part of the pipeline it does own.
From a modeled test to a real-human check
Subconscious can test or validate studies with real human participants. When a decision is close enough that the answer would change under real-world response, a team can move from a simulated test to real-human validation without changing the underlying causal question being asked.
Where to start
The worked example above is a demand-and-generation problem, but the underlying question, what does our forecast uncertainty actually cost us, and which risk policy fits our tolerance, applies to any budget commitment made before an outcome is known. Book time to walk through what quantifying that uncertainty would look like for a specific action under consideration.