Why Causal Effects Come With a Spread, Not a Single Number
A vendor hands you a causal effect with a confidence interval attached. Before a pilot budget moves, it helps to know where that interval comes from and why it isn't a single, exact number.
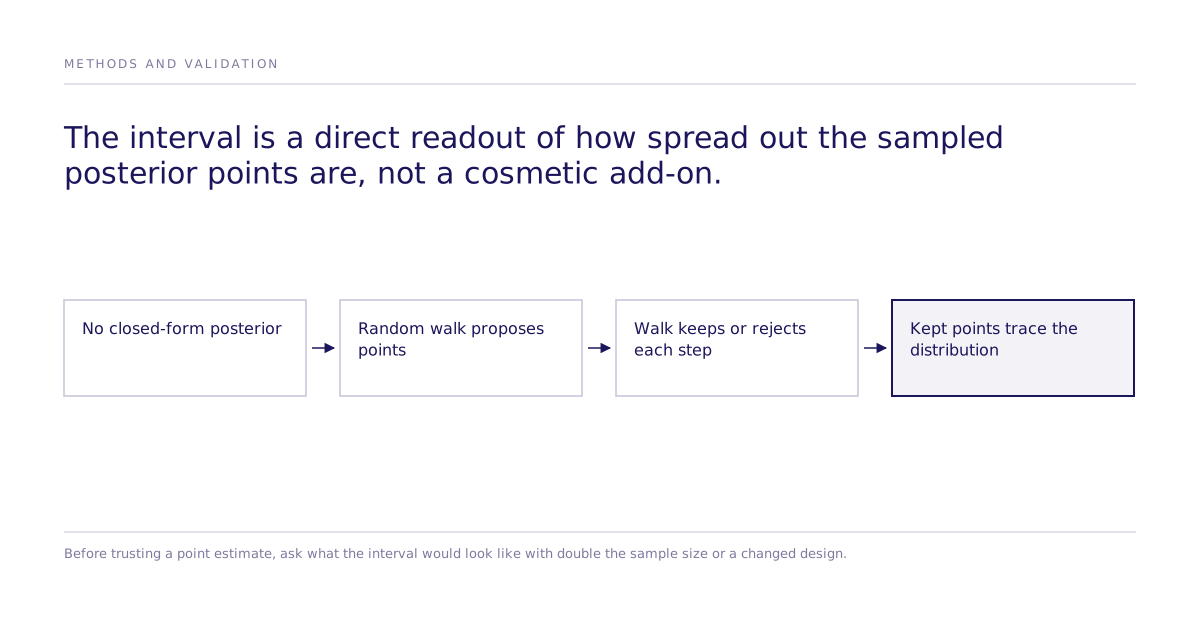
The posterior is usually too complex to solve directly
Bayesian inference updates a belief about an unknown quantity, say the effect of a price change, using observed data. The updated belief is called the posterior distribution. For simple problems, that distribution has a closed-form solution: plug in numbers, get an exact curve.
Most real problems aren't simple. Once a model has more than a handful of interacting parameters, the posterior has no closed form, only a way to describe its shape.
How does MCMC sampling work?
The common workaround is to build the posterior out of samples instead of solving for it in one step. A family of methods, generally called Markov Chain Monte Carlo, does this by taking a long random walk through the space of possible parameter values.
At each step, the walk proposes a nearby point, compares how well that point explains the observed data against the current point, and then keeps the proposal or rejects it and stays put. Repeated many thousands of times, the sequence of kept points is not a scatter of noise: it spends more time in regions that fit the data better and less time in regions that fit poorly. The random-walk Metropolis algorithm is the simplest version of this idea, and it explains the general mechanism most current samplers refine (Toptal, "Metropolis-Hastings and Bayesian Inference").
What do the resulting samples actually represent?
After enough steps, the collection of kept points approximates the posterior distribution well enough to use. No single sample is "the answer." The samples, taken together, describe a range of plausible values and how likely each one is relative to the others (QuantStart, "Markov Chain Monte Carlo for Bayesian Inference").
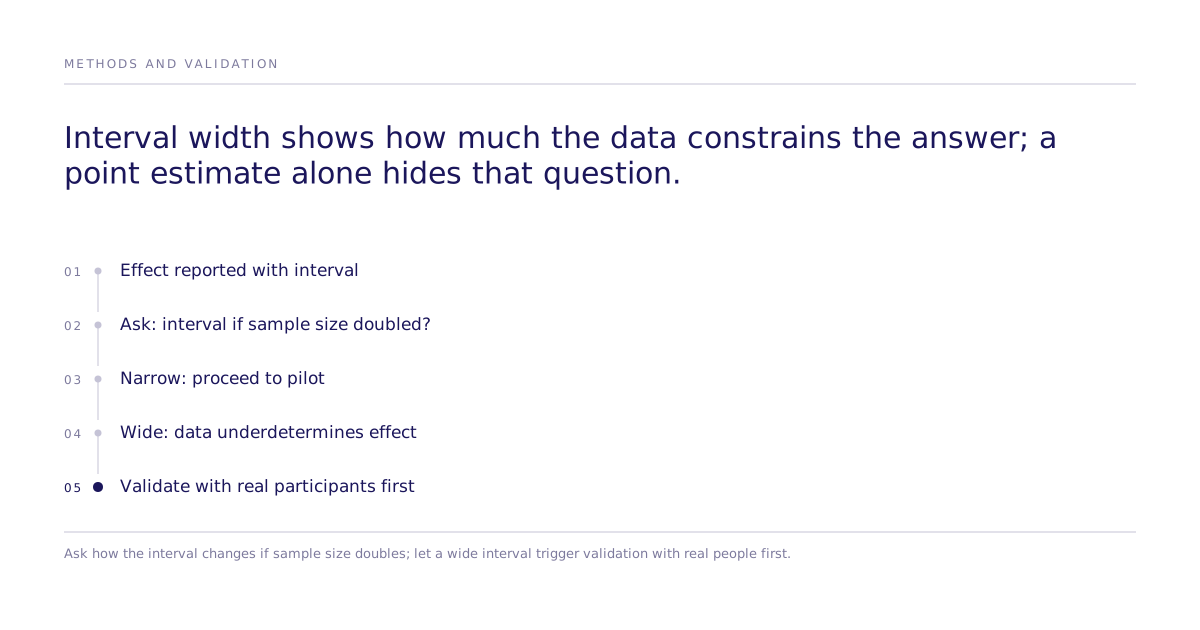
That is why a credible interval or error bar sits next to a reported effect: it is a direct readout of how spread out those samples are, not a cosmetic addition. A tight spread means the samples agree closely. A wide spread means the data supports a broader range of possible effects, and a decision built on the point estimate alone would be overconfident.
Reading a sampled result as a buyer
Subconscious reports causal effects on business actions with confidence intervals rather than a single number, estimated with DCE, mixed logit, and ICLV, where causality comes from the randomized experimental design rather than from any sampler: the interval reflects how much the data constrains the answer, following the same general logic as a sampled posterior's spread. It is not a claim that any particular sampling algorithm runs underneath Subconscious's experiments, but the general statistical logic that makes an interval meaningful, applying whether the underlying inference runs on a market simulation or a public-health dataset.
For a technical evaluator, the practical test is simple: ask what the interval would look like if the number of respondents were doubled, or the design were changed. A tool that can only produce a point estimate, with no visibility into how that estimate was assembled, does not let you ask that question.
Where does this reasoning stop applying?
This is general Bayesian-statistics intuition, not a description of any specific inference engine, benchmark, or customer result. A wide interval on its own does not tell you whether a model's assumptions are correct; it only shows how much the data constrains the answer given those assumptions.
When a decision depends on more than statistical mechanics, the same causal question can move from a simulated study to real-human participants without changing what is being tested. Subconscious can test or validate studies with real human participants, which is the check worth asking for before a pilot converts to a production commitment. The research program and replication leaderboard describe how that check is run, and how Subconscious's process works covers the steps between a defined decision and a reported effect.