Best Data Collection Methods for Quantitative Research
A quantitative research lead should choose the response source, measurement instrument and study design separately. Start with the decision: estimate population prevalence, compare stated preferences, or measure an actual change in behavior. A large response count or fast fieldwork does not establish that the evidence answers that question.
Separate four choices before collecting data
- Instrument: the questions, tasks or events being measured.
- Response source: customers, recruited participants, a panel or a simulation.
- Sampling: how the source represents the intended population.
- Design: whether the analysis describes responses or identifies a defined intervention effect.
Survey software can deliver a randomized experiment. A probability sample can answer a descriptive questionnaire. A simulated population can produce a stated-choice experiment. Those combinations have different sampling, causal and external-validity limits.
What does current evidence say about panel fraud?
NORC's April 2026 literature review cites industry estimates of 15 to 30 percent fraudulent responses, with higher rates on some platforms. These estimates are not a measured rate for every panel or for your study. The review recommends layered defenses, study-specific controls and probability-based designs with verified recruitment. It also warns that aggressive exclusions can remove legitimate participants and introduce bias.
Ask a provider to disclose recruitment routes, identity checks, exclusion rules, removed-response counts and sensitivity to those exclusions. A clean-looking response can still be fraudulent, and a response that fails an attention check is not automatically a bot. Fraud control and population representation require separate evidence.
Compare methods by the endpoint and the risk
| Method | Planning dependency | Main quality risk | What is directly measured? | Useful application |
|---|---|---|---|---|
| Nonprobability online panel survey | Recruitment access, screening and completion rules | Fraud, selection and respondent quality | Reported answers | Research when the source and limits fit the decision |
| Probability-based panel survey | Sampling frame, coverage, recruitment and weighting | Nonresponse, attrition and coverage | Reported answers from a defined sampling design | Population estimates with documented sampling uncertainty |
| Human discrete-choice experiment | Attribute discovery, design and participant sourcing | Hypothetical choices and external validity | Human stated choices, unless real transactions are measured | Comparing defined feature, price or message alternatives |
| Simulated discrete-choice experiment | Audience definition, design and validation plan | Model/population fidelity and external validity | Generated stated choices | Screening alternatives before an external check |
| Instrumented live experiment | Assignment, exposure, data quality and power | Interference, measurement and generalization | Actual outcomes in the tested setting | Estimating a piloted change's effect |
| Transactional data | Instrumentation, access and outcome definitions | Selection and missing counterfactuals | Recorded purchases or other behavior | Describing existing behavior; causal inference needs a suitable design |
Field time and cost depend on the audience, task, integration, design and review. Obtain a scoped estimate rather than assuming every panel takes days or every live test takes weeks. Interviews can help discover attributes and explanations before a quantitative design; a small exploratory sample is not a population estimate.
Do stated preferences predict actual choices?
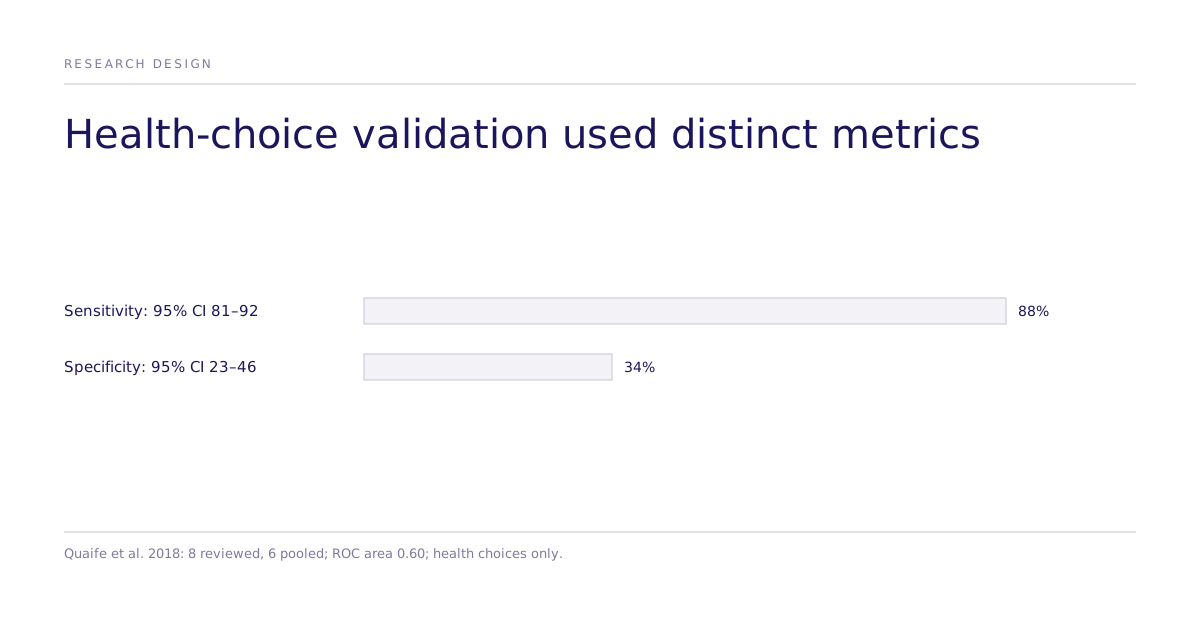
Quaife and colleagues' 2018 health-choice review included eight studies and meta-analyzed six. Pooled sensitivity was 88 percent (95% CI 81 to 92), specificity 34 percent (95% CI 23 to 46), and summary ROC area 0.60. Sensitivity measures correctly identified positive choices; specificity measures correctly identified negative choices. ROC area is a different discrimination metric, not another accuracy percentage.
The small health-study evidence base limits transfer to a new pricing or launch question. Define the positive event, prediction threshold, sample and actual-choice endpoint before interpreting a validation result. A pooled result does not calibrate a new market automatically.
Hypothetical bias also depends on the task and mechanism. Murphy and colleagues' meta-analysis found a median hypothetical-to-actual valuation ratio of 1.35 across 83 observations from 28 studies, with specification sensitivity. That historical result is not a universal discount for stated intent, conjoint results or simulated responses. Use suitable incentive alignment and matched behavioral validation.
What makes a comparison causal?
Randomization can support an effect estimate for the assigned contrast under the design's assumptions. Choice models estimate the resulting preference parameters; their names do not establish random assignment or transfer to human behavior. A flat multinomial logit imposes independence of irrelevant alternatives. Mixed Logit can relax that through heterogeneity; an ICLV label alone does not specify the substitution assumptions.
A simulated effect concerns generated responses under the tested model and conditions. Its interval does not automatically bound an effect in the real population. A live randomized design concerns actual outcomes in its tested setting, with its own interference, measurement and generalization limits.
How should a buyer assess a validation record?
The Subconscious July 2026 working paper reports mean Spearman rank correlation on estimated choice parameters of 0.55 across roughly 300 studies and 0.73 across 43 design-filtered studies. It is not peer reviewed; those aggregates are neither accuracy percentages nor demonstrated effect-size agreement. Per-study replication data is not yet public, and training-data contamination remains a concern.
Ask for validation matched to the proposed task, audience, outcome and analysis. Keep a held-out behavioral check separate from internal consistency, attention checks or completion rate. Inspect the public evidence record and methods guides for the relevant distinctions.
A checklist for the next study
- Name the decision and endpoint before choosing software.
- Document source, sampling, coverage and fraud controls.
- Specify assignment and analysis for the intended contrast.
- Report uncertainty with its actual scope and assumptions.
- Plan a matched human or live check when the commercial application requires it.
Take a previous study and compare its claimed endpoint with what it actually measured. If the decision needs actual purchase behavior and the record contains only stated intent, define the missing validation. Book a decision review with the previous instrument, audience and outcome data; the comparisons hub covers adjacent method choices.