How to Get Participants For Your Study
If a study needs 300 accepted completions by next Friday, define eligibility, required precision, invitation access, and quality review before selecting a source. Recruitment determines who can answer; the instrument determines what response the study measures.
- Define the target population, screener, quotas where appropriate, task length, incentive, consent, and deadline.
- Assess coverage and likely qualification, response, and quality-loss rates using a pilot or relevant prior fielding.
- Request available eligible sample and a dated quote; budget invitations and accepted completions separately.
- Specify quality checks and review exclusions, alongside assignment, endpoint, and analysis.
- A generated response is not a recruited participant or a substitute for evidence that requires actual people.
A recruitment plan before the deadline
Choose the source for the required population: existing customers for customer-specific questions, a specialist panel for screened roles, an appropriate probability-based source for population estimates, or community recruitment when its coverage limits fit the purpose. Obtain permission to invite. Pilot the screener and task, then estimate invitations from qualification, completion, and acceptance rates. Agree contingencies for low incidence or slow fielding, and report rejected responses separately from accepted completes.
What does published panel-quality evidence show?
Douglas, Ewell, and Brauer's study, published March 2023, defines high quality as passing at least four of five attention checks plus identity, location, timing, open-response, and self-report criteria. Its table 2 reports:
| Study configuration | Composite high-quality respondents | Historical cost per high-quality respondent |
|---|---|---|
| Prolific | 67.94% | $1.90 |
| CloudResearch MTurk Toolkit | 61.98% | $2.00 |
| MTurk | 26.40% | $4.36 |
| Qualtrics | 53.22% | $8.17 |
Qualtrics was directly assessed on all five checks; for example, its color-recall pass rate was 93.56%. These historical configurations and composite criteria do not establish current prices, universal provider rankings, representativeness, or purchasing validity.
Can synthetic respondents replace a human panel entirely?
Bisbee and colleagues' 2024 ANES comparison found 48% of estimated regression coefficients significantly differed between ChatGPT and human responses; signs reversed in 32% of those mismatched cases. This concerns the tested model vintage, demographic regressions and political feeling-thermometer responses. It demonstrates a risk in that setting rather than a universal rate for every synthetic study.
Where fraud filtering and causal design solve different problems
The reason buyers conflate these two fixes is that both happen inside the same "collect responses" step of a study, which makes it easy to assume that fixing one fixes the other.
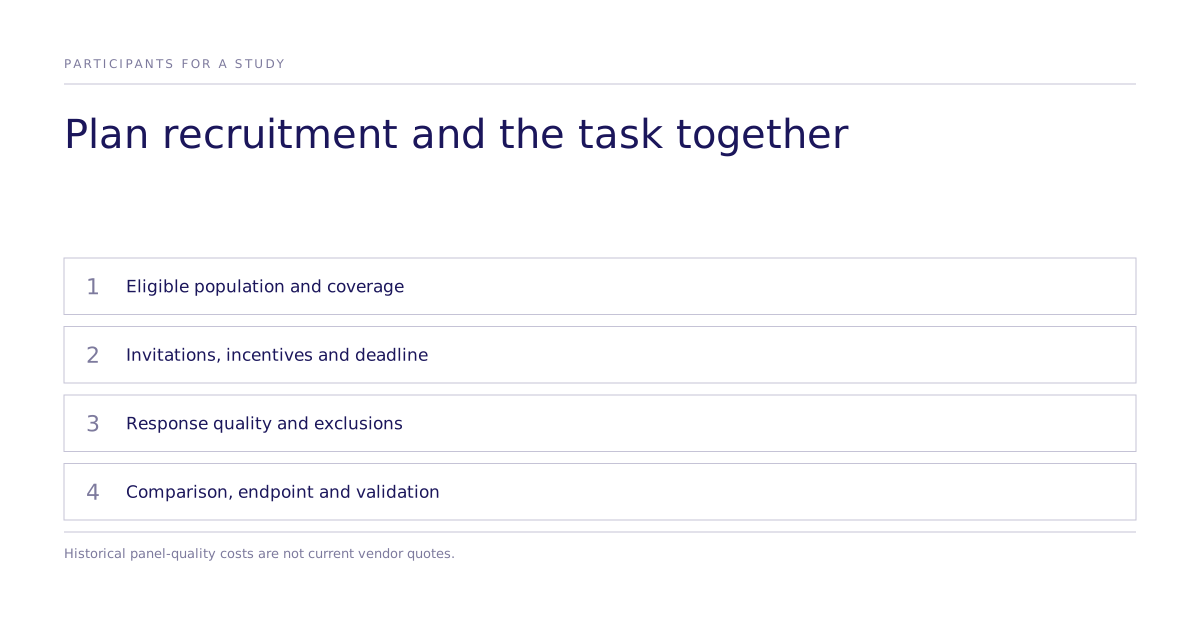
Passing quality checks does not establish that the task answers the decision. Conversely, a randomized task still needs eligible participants, adequate precision, and relevant population coverage.
Does randomization close the stated-preference gap?
Random assignment can identify the specified intervention contrast on the measured response under the design's assumptions. A hypothetical purchase task remains stated preference. Incentive alignment, relevant behavioral calibration, or a live purchasing test may supply additional evidence. Choice models estimate choice data; they do not themselves create causal identification.
How does a buyer validate a sourcing decision against real behavior?
For a generated study, inspect matched held-out human evidence, possible training overlap, the endpoint, and uncertainty method. Subconscious's public working paper reports aggregate agreement in estimated choice-parameter ranks. It does not validate a new recruitment source or publish per-study replication data. Conditional intervals do not cover all generator bias or transfer error.
Choose the source and design together
Confirm eligible availability, invitation permissions, sample plan, incentive, quality criteria, deadline contingencies, and the endpoint needed for the decision. Use current quotes rather than treating historical study costs as today's prices. Read methods and validation, related comparisons, or discuss recruitment and study requirements.