How to Run a Shelf Simulation Before a Retailer Meeting
On this page
A category lead preparing for a retailer meeting needs to decide which shelf change to recommend and what evidence supports it. A virtual store is an environment; human or generated shoppers are different response sources. A randomized shelf design can estimate a tested contrast on its measured endpoint. Actual category dollars require quantity, incidence, and market assumptions with independent validation.
- Define the actual deadline, planogram alternatives, shopper population, and retailer endpoint before selecting a simulation.
- Validate the environment and respondent model separately. Evidence about humans using a virtual store does not validate AI shoppers.
- Randomized complete-layout comparisons can identify their combined effect; separating individual attributes needs an appropriate identified design.
- Relative effects also require transfer evidence. A human virtual-store validation does not establish synthetic shelf-choice fidelity.
- Report the measured outcome, tested attribute support, assumptions, uncertainty, and required store check.
What decision does a shelf simulation need to answer before a retailer meeting?
Specify whether the unknown is attention, stated selection, basket quantity, actual spend, or store revenue. A randomized comparison of complete planograms can estimate the complete-layout contrast; it cannot isolate a single element that changes alongside others. A preference ranking can be useful for the response it measures, but does not itself identify a category-dollar effect.
What does the human virtual-supermarket study establish?
Waterlander, Jiang, Steenhuis, and Ni Mhurchu's 2015 study asked New Zealand adult household shoppers to make three virtual shopping trips and collect real receipts over the same period. Of 123 consenting participants, 74 completed three virtual shops and 60 returned receipts. The same four food groups led relative expenditure in both settings, with significant differences in six food groups. This validates aspects of human behavior in that particular environment and task; it does not study AI respondents or establish an effect of a new planogram.
Where a realistic shelf still misleads the room
An illustrative fixed-cell study may compare three complete layouts; a human or modeled factorial study may vary attributes across tasks. Neither response source imposes a universal three- or four-cell limit. Choose configurations from the intended contrasts, identification constraints, burden, sample support, and cost rather than assume more cells always improve evidence.
How does randomizing the shelf change what you can claim?
Randomizing shelf attributes can identify tested contrasts on recorded choices under the design assumptions. Constraints may prevent independent variation, and generated respondents may not perceive images or spatial layout like humans. Confirm stimulus support and matched response validation. To translate choice to category value, specify purchasing incidence, quantities, prices, availability, and outside options, then calibrate and evaluate against independent records.
Choose an estimator that fits the design and response data. Standard multinomial logit imposes independence of irrelevant alternatives; mixed logit can allow taste heterogeneity and different substitution patterns. ICLV adds assumptions about latent constructs, not verified hidden motives. Estimator choice does not supply causal identification or market transfer. Training exposure also requires independent new-task checks, rather than an unsupported protocol guarantee.
Conventional cell testing versus a randomized shelf design
| Dimension | Complete-layout comparison | Attribute-based design |
|---|---|---|
| Configurations | Defined complete layouts with suitable assignment | Attribute combinations selected for the intended contrasts and constraints |
| Estimate | Combined layout contrast on the measured response | Identifiable attribute or interaction contrasts on the measured response |
| Response source | Human or generated shoppers; validate each source separately | Human or generated shoppers; a shared environment does not establish equivalent perception |
| Value claim | Needs incidence, quantity, price, and independent calibration | Needs the same additional value-model evidence |
| Useful role | Comparing complete shelf alternatives | Studying specified elements where identification and support permit |
Which evidence supports a new retailer category?
The July 2026 causal fidelity working paper reports aggregate estimated choice-parameter rank replication, including a mean of 0.73 across 43 design-filtered studies. It does not establish visual shelf perception, absolute buying probabilities, or category dollars for this retailer. Ask for independent matched evidence on the intended stimuli, shopper population, and endpoint.
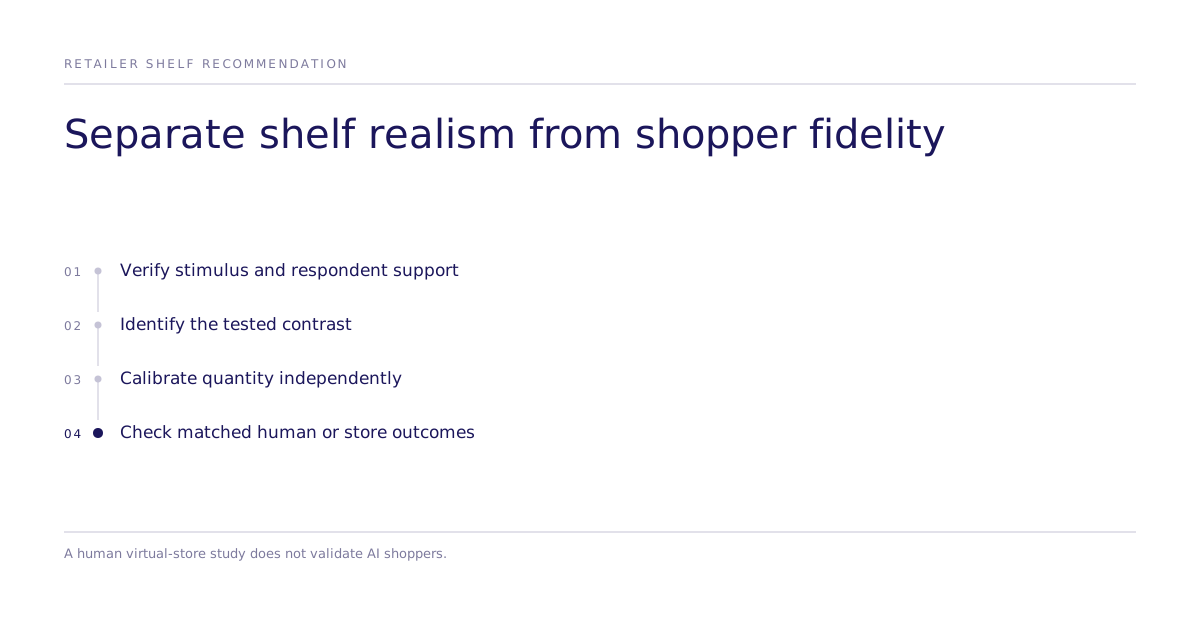
Per-study replication data are not public. The public evidence record summarizes aggregate results and cannot establish this retailer's study fidelity.
What the interval covers, and what it doesn't
An interval describes uncertainty for the defined estimate under model and design assumptions. It does not automatically include generator bias, visual-perception error, population coverage, unsupported attribute combinations, or store-network transfer. State which attributes varied, which were fixed, and which interactions are identified. Document substitution assumptions and relevant sensitivity checks.
What to bring into the line review
Bring the complete alternatives or identified attribute contrasts, the actual measured response, uncertainty, and study support. For a category-dollar scenario, include quantity and incidence calibration, outside options, current price facts, and a matched independent check. Label modeled value assumptions rather than present them as observed store revenue.
List facings, adjacency, block position, price, pack, and any constraints the recommendation depends on. Confirm stimulus support and identification, preserve baseline and borderline layouts, and define an independent store or human check. Discuss the scope before promising a retailer-facing effect.