How inflation impacts different businesses
A pricing leader deciding how to pass through cost increases needs to compare customer impact with contribution margin. Price, pack size, and product quality are useful levers for packaged goods; a service or B2B business may also change delivery terms, discounts, sourcing, or operating costs. Start with the cost exposure and the alternatives available for each product.
- Compare input costs, contracts, unit economics, and substitution options before assigning an industry-wide pricing response.
- GAO's 2025 analysis found average per-unit price increases of about 12% to 32% among downsized items in seven selected categories during 2021–2023. That range does not describe every product or the 2019–2024 period (GAO).
- Experiments published in July 2026 found stronger negative reactions to quality cuts after consumers learned about them, with important exceptions for transparent communication and peripheral attributes (Journal of Consumer Research).
- A randomized choice task estimates responses to the offers shown. Human stated choices and model-generated choices still need checks against actual switching, purchase, and product experience.
- A February 2022 pricing guide recommends customer- and product-specific decisions, including protecting key-value items; treat it as a framework, then check present costs and demand (McKinsey).
Why does inflation hit industries so differently?
Cost structure changes the decision. A transport business can examine fuel exposure, contract renewal dates, and service levels; a packaged-goods brand can compare sticker price, quantity, and formulation; a luxury brand can examine craftsmanship, distribution, and substitution. These are candidate questions, not claims that every business in a sector follows the same response. GAO's narrower evidence concerns downsized items: its 2021–2023 analysis estimated average per-unit increases from 11.6% for paper towels to 32.4% for coffee across seven selected categories. The separate 2019–2024 analysis concerned inflation measurement, not that range (GAO).
The three pass-through levers: price, pack, and quality
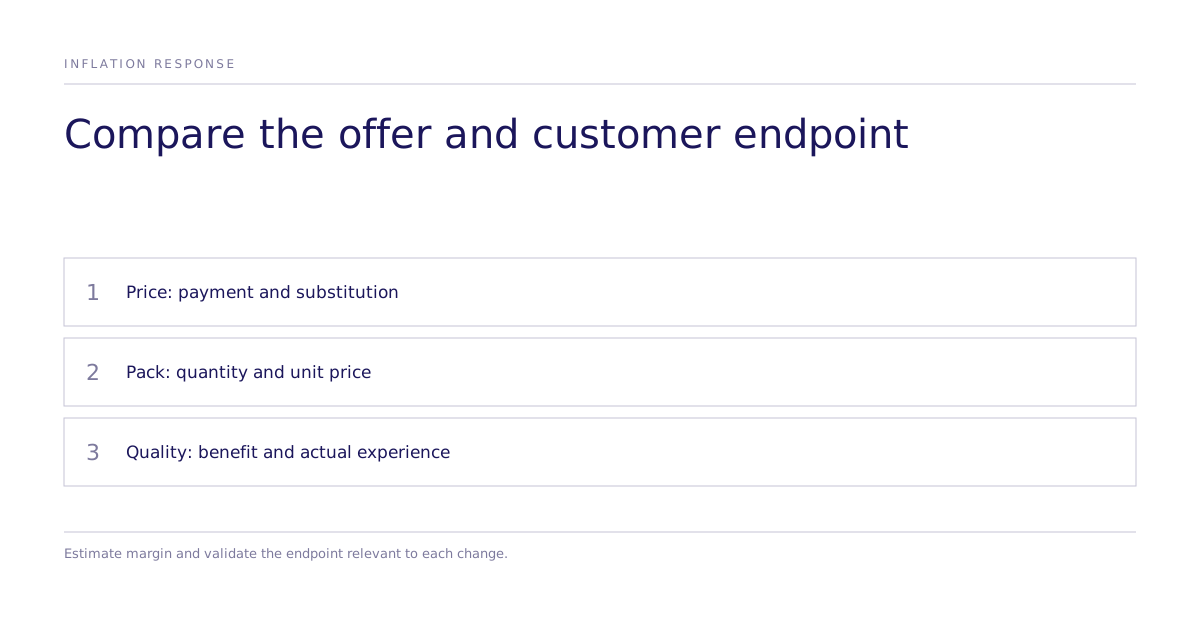
Price, pack, and quality change different parts of an offer. A smaller pack can preserve a sticker price while increasing the unit price; a formulation change may alter a central benefit or a peripheral detail. Compare feasible alternatives at the same margin objective, disclose changes clearly, and include keeping the offer unchanged. Other options, such as productivity improvements or delivery terms, may be more relevant outside packaged goods.
What the skimpflation experiments actually show
The July 2026 Journal of Consumer Research paper examines reactions after consumers are informed of a change. Quality cuts drew stronger negative responses in those experiments, but the penalty was reduced by transparent communication, could disappear for peripheral attributes, and was weaker when consumers could recover the original experience. The study does not rank spontaneous detection rates or net marketplace profitability over time (Journal of Consumer Research). A description-based choice task can test a disclosed trade-off; a sensory or service change may also require actual product use.
What the conventional "segment by stated sensitivity" playbook misses
Self-reported price sensitivity can help describe customers, but a general attitude question does not identify the response to a particular price, pack, or quality change. A randomized human survey can estimate an effect on stated choices under its design assumptions. To learn actual switching, use transaction evidence or a feasible field test that addresses confounding. Distinguish awareness of a change, the reaction after learning about it, and behavior after using the revised product.
What does a randomized choice experiment add?
A choice experiment varies offer attributes under a specified assignment design. Random assignment can identify effects on the measured choice endpoint when the design assumptions hold; it does not turn a hypothetical task into an observed purchase. McFadden choice models, mixed logit, and ICLV analyze the responses. Check substitution assumptions and model fit rather than assuming a more elaborate estimator removes every bias. For a quality change, validate that participants can understand or experience the difference. Generated choices additionally depend on model and population coverage.
For a simulated screen, request validation matched to the attributes, population, and endpoint. The July 2026 causal fidelity paper reports mean Spearman correlations on estimated choice-parameter ranks of .73 across 43 design-filtered studies and .55 across roughly 300 replications. These aggregates do not calibrate inflation-related sales effects. Intervals quantify uncertainty conditional on the analysis; they do not establish market transport or eliminate training-data overlap. Per-study replication data is not public. The leaderboard summarizes aggregate evidence, and methods and validation explains the limits.
Which lever fits which business?
| Lever | What changes | Evidence to collect | Practical constraint |
|---|---|---|---|
| Price increase | Amount paid for the offer | Actual conversion, margin, substitution, and responses to feasible alternatives | Contracts, competitor offers, and customer communication |
| Pack shrink | Quantity and unit price | Unit-price understanding, purchase response, and repeat purchase | Packaging, labeling, and retailer requirements |
| Quality cut | Ingredient, material, or service attribute | Disclosed trade-off, actual experience, complaints, and retention | Safety, standards, central benefits, and recoverability |
What should a senior pricing buyer do this quarter?
Build a product-level margin bridge before choosing the research method. Specify the unchanged offer and the feasible alternatives, include no purchase or a relevant substitute, and decide what result would change the decision. Use a choice experiment for stated trade-offs, product testing for experience, and a feasible field test for actual purchase effects. An estimated preference threshold needs market checks before it becomes a rollout rule. Examples of scoped pricing decisions are in the case studies.
List the products facing a price, pack, or quality decision and the customer endpoint that matters for each. For a study design review, bring the cost bridge, feasible alternatives, current offer, and available transaction or product-test evidence to meet.