Nike Leads Conjointly's US Sneaker Tracker: Compare Funnel Transitions
A brand strategist allocating sneaker marketing spend needs to distinguish brand tracking from sales and from intervention evidence. Conjointly's April 2026 US sneaker report puts Nike ahead on aided awareness, consideration, and preferred brand. Skechers and Jordan show strong results at particular funnel transitions; a transition ratio alone does not explain why buyers chose the brand.
- Conjointly reports Nike at 89% aided awareness, 72% consideration, and 31% preferred brand in its first published US sneaker wave (Conjointly).
- Heuritech's separate global 2025 summary reports Nike, Adidas, and New Balance at 34%, 26%, and 14% respectively: 74% together, rather than percentages within a three-brand subgroup. Check that report's geography and measurement method before comparing it with US survey scores (Heuritech).
- Heuritech reports Skechers' 22% social-visibility growth in the male segment; Mizuno had the largest reported average visibility growth, at 30%. Visibility is a different endpoint from sales or preference (Heuritech).
- Skechers and Jordan have reported aided awareness of 63% and 66%, so describing either as a tiny aware base misstates this tracker.
- A funnel suggests hypotheses. A randomized human choice study or a feasible live test can address a changeable lever on a defined endpoint; a modeled screen needs additional evidence before a spending decision.
What Nike's lead in this tracker measures
Conjointly published the first US sneaker findings in April 2026. The study surveyed 1,427 US adults, including 393 qualifying recent sneaker buyers recruited through its compensated panel network, and weighted the sample to national demographics. Nike leads the reported funnel metrics. These are weighted survey estimates, including self-reported purchase and preference, rather than audited sales or a causal estimate of a marketing change (Conjointly). When using a transition ratio, request its eligible base and uncertainty as well as the topline percentage.
What do Skechers' and Jordan's transition ratios mean?
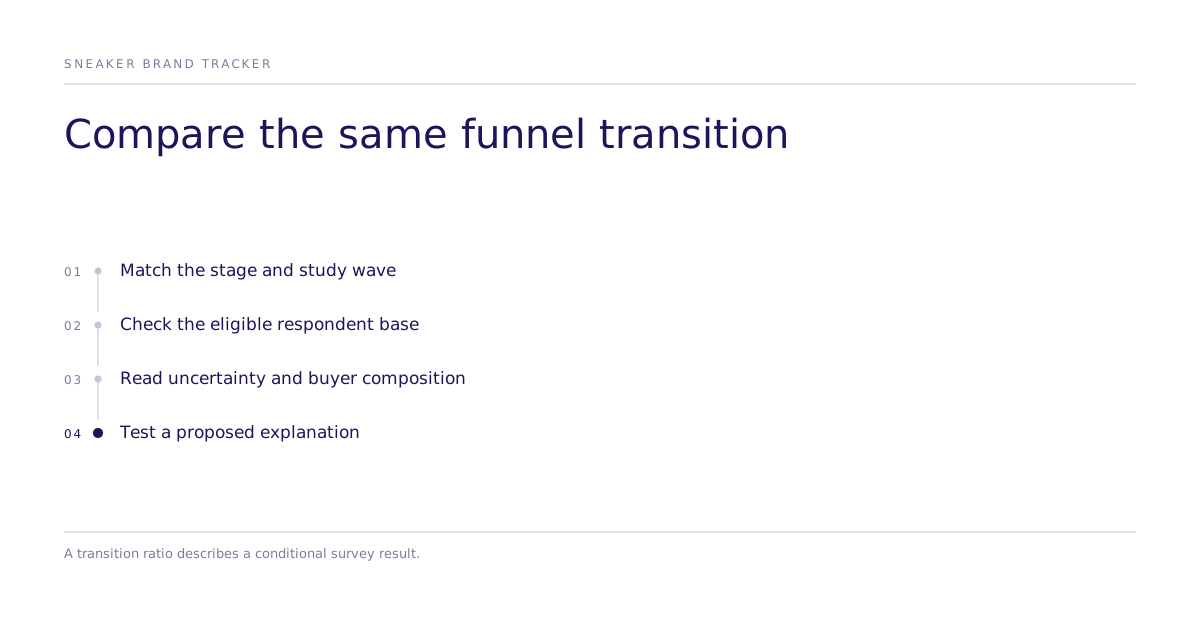
A transition ratio describes the share reaching the next stage among those eligible at the previous stage. It should be compared at the same transition and with the same denominator. Conjointly reports strong awareness-to-consideration conversion for Jordan and strong subsequent transitions for Skechers; Hoka leads the reported purchase-to-preferred-brand transition. These results do not establish that one brand converts best at every stage. Differences in buyer composition, offers, and availability are possible explanations to investigate, rather than a demonstrated selection mechanism.
What the funnel can't tell a buyer
A preferred-brand response does not show whether price, comfort, endorsement, distribution, or recent advertising produced the preference. Past purchase in this tracker is self-reported. Neither metric supplies the counterfactual for a new offer. For example, a hypothetical Nike price reduction, Jordan mid-tier offer, or Skechers comfort message would require a design tied to stated choice or actual purchase, depending on the decision.
How can a team test a changeable lever?
A randomized choice study can vary realistic price, style, endorsement, and availability attributes with a current-offer baseline and no-purchase option. Randomization identifies contrasts on the measured task endpoint under the design assumptions. A human survey records stated choices; a simulated study records generated choices. McFadden choice models, mixed logit, and ICLV are estimators, with assumptions about preferences and substitution that need checking. Distribution or media effects on actual purchase may require a live experiment with suitable units, interference controls, and transaction outcomes. Design choices are discussed in methods and validation.
What validation should a simulated sneaker screen provide?
Request evidence matched to the sneaker population, attributes, and endpoint. The July 2026 causal fidelity paper reports mean Spearman correlations on estimated choice-parameter ranks of .73 across 43 design-filtered studies and .55 across roughly 300 replications. Those aggregates do not establish sneaker purchase accuracy or sales lift. Training-data overlap and transport remain concerns, and per-study replication data is not public. Intervals reflect conditional uncertainty in an analysis, not an unconditional bound on real US sneaker demand.
Brand tracking and experiments answer different questions
| Brand funnel tracking | Randomized discrete choice experiment | |
|---|---|---|
| What it measures | Weighted survey reports of awareness, consideration, purchase, and preference | Stated or generated choice responses to tested attributes; a field experiment can measure observed purchase |
| What it answers | Relative position at a specified wave and funnel stage | A defined intervention contrast on the endpoint actually measured |
| Main blind spot | No identified cause of a brand difference; conditional ratios need their eligible bases | Design assumptions, tested attribute coverage, model fit, and transport to buying behavior |
| Best for | Monitoring brand position with comparable waves | Testing a specified offer or message before a broader decision |
More comparisons like this one live in the comparisons hub.
What a lever test would actually look like for Nike, Skechers, and Jordan
For Nike, compare feasible price and availability alternatives against the current offer. For Skechers, comfort and price framing are candidate hypotheses. For Jordan, compare a mid-tier offer or wider availability with the current proposition, and measure whether the change affects stated choice and brand perception. These are proposed tests, not explanations already established by the funnel. Keep a current-offer baseline and retain borderline alternatives for independent checking if a modeled screen narrows the list.
Read the aggregate leaderboard and the validation methodology for the evidence limits. To scope a sneaker decision, bring the tracker wave, eligible bases, candidate levers, and intended business endpoint to the team.