Source of Volume Analysis: Category Growth vs Brand Switching
On this page
An innovation or category lead evaluating a listing needs to distinguish category expansion, switching from competitors, and losses to the brand's own line. A pre-launch shelf task can compare choices with and without the new item. Turning that comparison into incremental units also requires realistic outside options, purchase occasions, and calibration to market behavior.
- Source-of-volume splits into category growth, competitive switching, and self-cannibalization, and the split depends on which measure you use, not just which data you have.
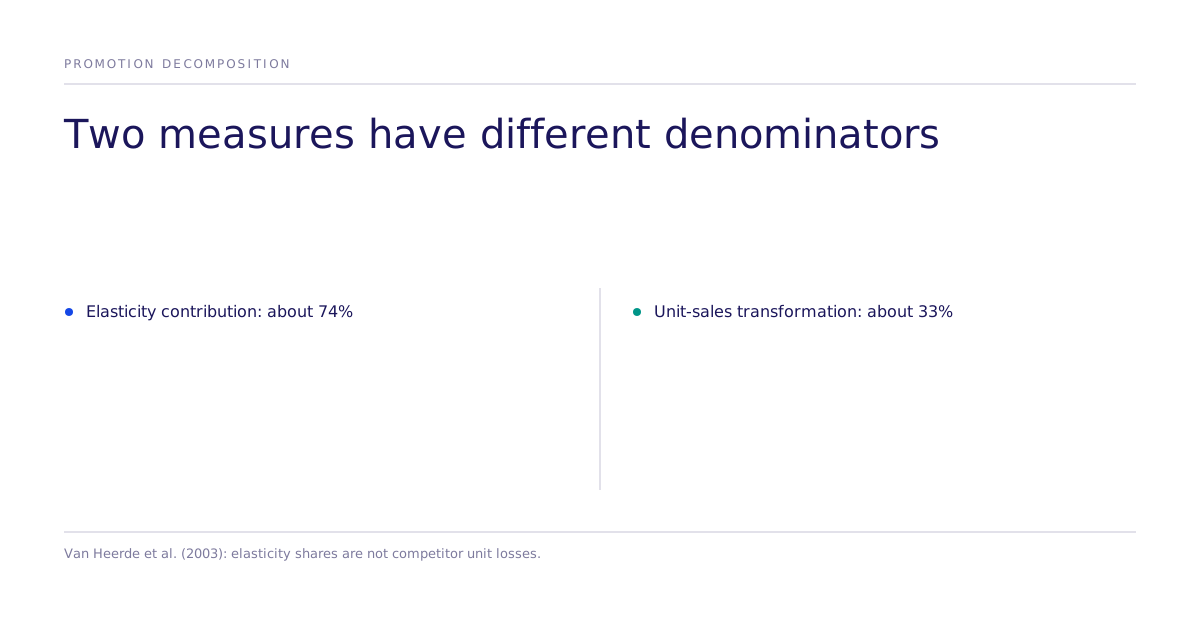
- A 2003 paper shows why an average 74% elasticity-based switching contribution does not mean that competitors lose 74 of every 100 added units. Its transformation of previously reported results gives about 33% in unit-sales terms (van Heerde, Gupta, and Wittink).
- Household panels can describe observed buying after launch and inform a pre-launch baseline; causal attribution still needs an appropriate design or identification strategy.
- Standard multinomial logit imposes substitution restrictions. Check whether they fit the category rather than assuming the closest sibling always bears the largest loss.
- Include the own line, competitors, and realistic no-purchase or outside alternatives. Report each component's uncertainty and the assumptions that convert choices into units.
Why do two respected decompositions disagree on the same promotion data?
Van Heerde, Gupta, and Wittink explain that decomposing elasticities and decomposing unit-sales changes answers different questions. Earlier elasticity results attributed approximately 74% on average to switching. The authors derive transformations and apply them to previously reported results, obtaining approximately 33% of increased units from other brands' losses. This is a demonstration about measurement, rather than two conflicting estimates of a single promotion's unit loss (JMR, 2003).
Why are the retailer and the CFO asking the same underlying question?
A retailer may assess category contribution alongside assortment, margin, and operating constraints. The CFO needs the new item's incremental contribution after losses to the own line and launch costs. Use a consistent baseline, time window, and unit definition so the estimates can be reconciled. Shared data can support several estimands, but category expansion, competitive loss, and own-line loss are not identical quantities.
How should a choice model handle cannibalization?
Standard multinomial logit imposes proportional substitution conditional on the specification. A close sibling may violate that pattern, but the direction and size of the error are empirical questions. Mixed logit or other suitable structures can allow richer substitution; ICLV additionally requires a latent-variable measurement model and does not automatically solve substitution. Compare specifications, own-line alternatives, and held-out task predictions before using a cannibalization estimate.
How do you decompose source of volume before the listing is funded?
Randomize comparable shelf contexts with and without the proposed item where the design permits it. Include own-line and competitor alternatives plus a realistic outside option. Prespecify the population, purchase occasion, quantity assumptions, and treatment exposure. Human tasks measure stated choices and simulated tasks measure generated choices. Changes in task shares can describe modeled switching or opt-out movement; they do not establish new category buyers or incremental units without incidence, frequency, quantity, and market calibration. Report component-specific intervals and joint uncertainty.
| Method | When you get the answer | How it handles the sibling item | Best for |
|---|---|---|---|
| Household panel analysis | Observed purchase patterns, with baseline information useful before a new launch | Measures own-line buying; causal interpretation depends on identification | Observed switching, quantity, timing, and calibration checks |
| Single-item purchase-intent study | Stated response before launch | Requires assumptions about competitors and the own line | Understanding a concept, with limits on unit forecasting |
| Randomized shelf-set task | Stated or generated choices under assigned contexts | Includes the own line and outside option explicitly | Comparing tested alternatives, followed by market calibration |
What evidence supports a pre-launch source-of-volume estimate?
Request matched evidence for category incidence, substitution, and the conversion from task responses to units. The public Causal Fidelity paper reports aggregate estimated choice-parameter rank correlations; it does not validate retail source-of-volume forecasts for this category. Per-study replication data is not public, and the leaderboard is an aggregate evidence summary. Conditional intervals do not eliminate task bias, model misspecification, training-data overlap, or market-transport risk.
What should the category lead bring to the retailer meeting?
Bring the tested shelf contexts, outside option, choice shares, unit-conversion assumptions, and margin bridge. Report separate intervals for expansion, competitor switching, and own-line cannibalization, together with their covariance or a joint uncertainty calculation that preserves the decomposition. The retailer and CFO can use the same coherent model while evaluating different outcomes. Label whether each result is a task estimate, a calibrated forecast, or an observed market effect.
Before the listing pitch, mark which source-of-volume components are measured and which depend on assumptions. Check whether the time window distinguishes immediate purchase, stockpiling, and later demand. Bring the shelf alternatives, baseline, outside option, and calibration evidence to meet to scope the missing comparison.