Causal AI: What It Is and What It Buys a Business Decision
Three price points sit on a CPG pricing lead's desk before a shelf reset; none of last year's sales data covers any of them. Causal AI answers what happens if we act, where predictive analytics answers what usually happens. What causal AI buys that lead is an estimated effect for the action on the table, with an interval and stated assumptions. A randomized choice experiment is one route to that estimate, and this article walks through it. Observational routes exist too, and they rest on different assumptions.
- The causal claim comes from the design and its assumptions. In a randomized experiment it comes from randomizing which price, claim, or pack a respondent sees. McFadden's conditional logit, Mixed Logit, and ICLV are models that read the result afterward. A discrete choice experiment is the design.
- A validation score is not a guarantee for a market that has not been tested.
- The concrete case: a pricing lead choosing among three shelf prices, walked through Judea Pearl's three rungs of causal knowledge: seeing, doing, imagining.
What is causal AI, and how is it different from predictive AI?
Causal AI estimates the effect of an action a business has not yet taken, by answering causal questions with causal models. Predictive AI (sales forecasting and most machine learning classifiers) describes what has usually happened given the conditions on record. Judea Pearl and Dana Mackenzie organized the distinction into three rungs of a ladder: seeing (association), doing (intervention), and imagining (counterfactual) (The Book of Why, 2018; Pearl, "The Seven Tools of Causal Inference"). The rungs classify the question and the causal information a method has. They do not reserve causal AI for any one platform.
Predictive AI sits on the first rung. Causal methods can reach the second rung, the effect of an intervention, in more than one way. Randomizing the action inside an experiment is the cleanest. Adjustment for confounders, natural experiments, and structural models can also identify intervention effects from observational data, and each rests on explicit, untestable-from-the-data assumptions. The third rung, counterfactuals about what would have happened under an action not taken, needs more structural information still. The tool category matters less than which rung the method actually reaches and which assumptions it needs.
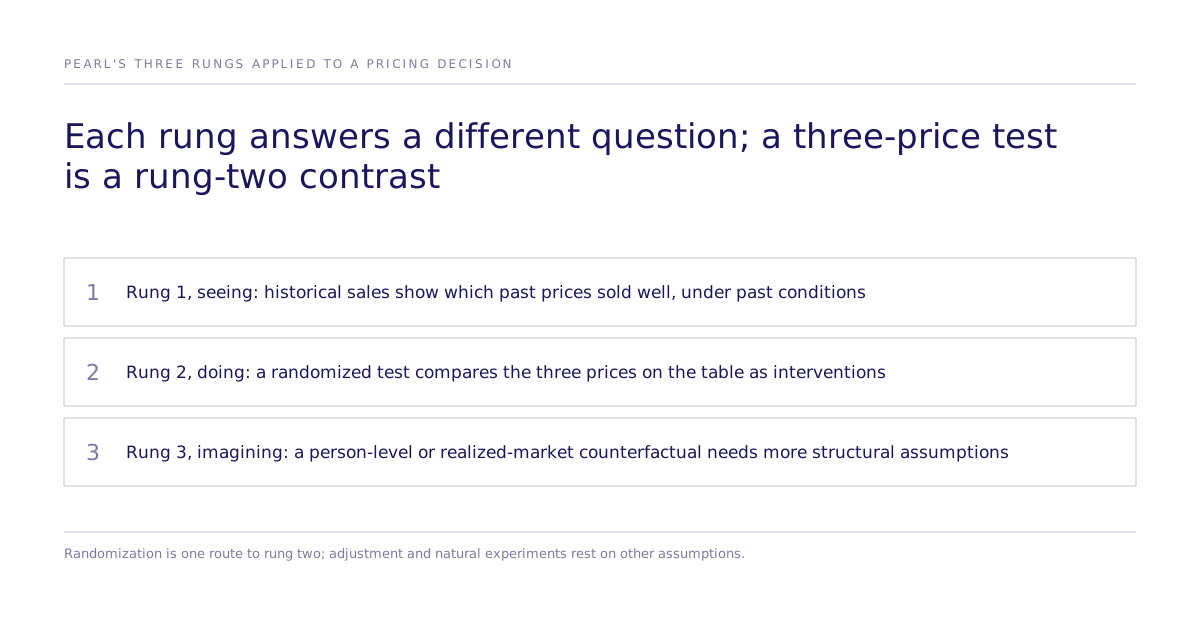
The decision: three prices, one shelf reset
The pricing lead's problem has a fixed shape: three candidate prices, a shelf reset date, and no history at any of the three price points. Historical volume data exists for the prices that were actually charged in the past, confounded by promotions, seasonality, and competitor moves at the time. None of it says what would happen at a price never charged.
The decision needs a declared objective, because volume and unit margin usually trade off as price moves. Suppose the lead chooses contribution profit, (price − unit cost) × units, with an assumed market size and cost. That objective names what the test must estimate: the effect of each price on choice, which is then combined with the margin at each price. This is a rung-two question, and it needs a rung-two method.
Rung one: what historical sales data and MMM can see
Historical sales analytics describe associations between past prices and volumes. Marketing mix models can support causal inference when their design and assumptions address confounding; the label alone does not establish identification. That is useful for monitoring a trend or forecasting near-term demand inside the range of prices already charged. An association alone cannot establish the effect of three untested prices. Extrapolation additionally requires assumptions about how demand behaves outside observed prices. A price move confounded with a promotion, a competitor stockout, or a seasonal shift can produce a correlation that does not isolate the price effect.
Rung two: where a randomized experiment operates
Randomize which of the three prices a respondent sees inside a simulated market, then estimate the effect of price on choice with an interval. The conditional logit, Mixed Logit, or ICLV model produces that effect from the experiment's data, and none of them is a causal method on its own. The causal claim comes from the randomization in the design, because price assignment did not depend on anything else about the respondent or the market. The model reads the effect out of data that randomization already made interpretable.
A flat logit model carries the independence-of-irrelevant-alternatives assumption and can misstate substitution when the alternatives are not equally distinct. Mixed Logit can relax that assumption through heterogeneous preferences. An ICLV model adds latent constructs; its substitution assumptions depend on the choice-model specification.
The interval from this experiment covers the effect within the simulated population tested, on a stated choice. It does not cover the real market unconditionally, and a stated choice is not a live purchase.
Rung three: the counterfactual
Rung three asks what would have happened under an action not taken, often for a specific unit. A three-arm randomized experiment gives a rung-two contrast: the average outcome if everyone saw price A, price B, or price C. That contrast serves the shelf reset directly. It does not by itself identify every rung-three query, such as what a particular shopper would have bought at another price. Those queries need extra structural assumptions about the same unit across conditions.
Business usage is looser. Advertising measurement calls a comparison a counterfactual when it builds the expected outcome without the spend. GeoLift builds a geo-level counterfactual by weighting untreated regions to approximate what the treated region would have done (GeoLift methodology). That is a useful estimate under its assumptions, and it differs from a person-level counterfactual. Running the three-price experiment before the reset gives a comparison for all three prices while the budget is still uncommitted.
How does causal AI compare to predictive AI and causal-inference libraries like DoWhy and EconML?
| What it answers | Where the causal claim comes from | Best for | |
|---|---|---|---|
| Predictive models (sales forecasting, ML models) | What usually happens, given the conditions on record | Correlation in historical data; no causal claim | Monitoring trends and forecasting demand inside the range of prices already charged. |
| Observational causal methods and libraries (DoWhy, EconML; adjustment, natural experiments, structural models) | The effect implied by a specified causal model, often applied to data already held | The model's assumptions, which the data alone cannot fully test | Teams that have, or will defend, a causal model and need effect-estimation code on data they hold. |
| Randomized experiments (including choice experiments on simulated or human respondents) | What happens if a specific untested action is taken, on the measured response | The randomized manipulation inside the design | A decision among specific untested actions, such as a price, a claim, or a pack, before committing budget. |
What causal AI is not
Causal AI is not a label that makes a prediction model causal. A graph inferred from patterns in existing data is a hypothesis about structure, and it needs to be tested before it drives a decision.
Causal AI is also not the estimator. Conditional logit, Mixed Logit, and ICLV are statistical models for reading an effect out of choice data. None of them manufactures a causal claim by itself, and applying one to observational data does not make the result causal.
A stated choice may differ from a consequential purchase. Validate the endpoint against matched behavior; incentive alignment can make a task consequential but does not guarantee market transfer.
No validation score guarantees that a method proven on past studies will hold in a market it has never been tested against. That gap is why the validation record has to be published with its limits.
Why does the validation record matter more than the method name?
A method's name, whether discrete choice, Mixed Logit or ICLV, says nothing about whether its output tracks real human behavior. Only a comparison with real humans answers that. The July 2026 causal-fidelity working paper, not peer reviewed, reports Spearman rank correlations between parameters estimated from simulated and human choices: a mean of 0.73 across the 43 studies that passed its design filters, and 0.55 across roughly 300 replications. These measure how well the order of estimated parameters matches. They do not measure effect-size agreement or the accuracy of a particular forecast. One caveat travels with these numbers: a published validation study can sit inside a model's training data, and a model scored on a study it has already seen is not a fair test. A held-out claim needs evidence that the comparison was not available during training; a protocol alone does not establish that. More comparisons against this standard are in the methods and validation hub.
What should a pricing lead actually do before the shelf reset?
Declare the objective, such as contribution profit, with the market size and cost assumptions. Check whether the method proposed for the decision has a published comparison with human behavior, and ask to see its misses along with its wins. List the three prices, define the outcome metric before running anything, and confirm the test assigns respondents to prices at random rather than reading last year's sales by tier. See the published evidence and its limits on the research page. To talk through which price to test first, book a decision review.