Classifying Types of Conjoint Analysis
Choosing a conjoint format means choosing a respondent task. Choice-based conjoint (CBC) asks people to select a profile; adaptive choice-based conjoint (ACBC) tailors parts of that task to earlier answers. Ranking orders profiles, while rating assigns each profile a scale value. MaxDiff asks for best and worst items from a list. It is a related preference-elicitation method, not automatically a product-bundle conjoint.
- Use CBC for trade-offs between multi-attribute alternatives.
- Consider ACBC when an adaptive task suits the attribute set and respondent burden.
- Use MaxDiff to prioritize individual items or messages.
- Separate ranking from rating: relative order and scale scores are different observations.
- Check external validity separately from task format.
How do the formats differ?
The Sawtooth method-selection grid last updated November 1, 2018, provides a vendor's comparison of conjoint approaches. Treat it as a starting point for designing a task, rather than proof of purchase prediction.
| Format | Respondent task | Best for | Analysis caution |
|---|---|---|---|
| CBC | Choose among product profiles | Bundle and price trade-offs | Include realistic alternatives and an opt-out where appropriate |
| ACBC | Answer screening and choice tasks adapted to prior responses | Exploring a larger attribute set | Adaptation changes which tasks respondents see |
| MaxDiff | Select the best and worst items in a subset | Prioritizing a list of claims or features | Item priority is not demand for a bundle |
| Ranking | Order profiles from most to least preferred | Relative ordering of a manageable set | Ranks do not measure the distance between preferences |
| Rating | Give each profile a scale score | Evaluating profiles individually | Scale use can differ between respondents |
For example, CBC might ask which subscription a respondent would choose at the displayed prices. A ranking task asks them to order those subscriptions. A rating task asks them to score each one. Those answers require different likelihoods or analysis procedures; they cannot all be treated as identical discrete choices.
Why isn't selecting a format enough?
A stated-preference task can reveal trade-offs under its own conditions. It does not automatically establish what happens when someone pays, faces competing products, or makes a decision later. Hypothetical willingness-to-pay can differ from consequential willingness-to-pay, with the direction and size depending on incentives, population and elicitation. Do not apply a universal multiplier to correct it.
The distinction also applies to model-generated choices. Random assignment of attributes identifies assigned contrasts inside the configured simulation, subject to the design and analysis assumptions. The generated outcome is modeled stated choice. Transfer to human choices or purchases requires matched evidence.
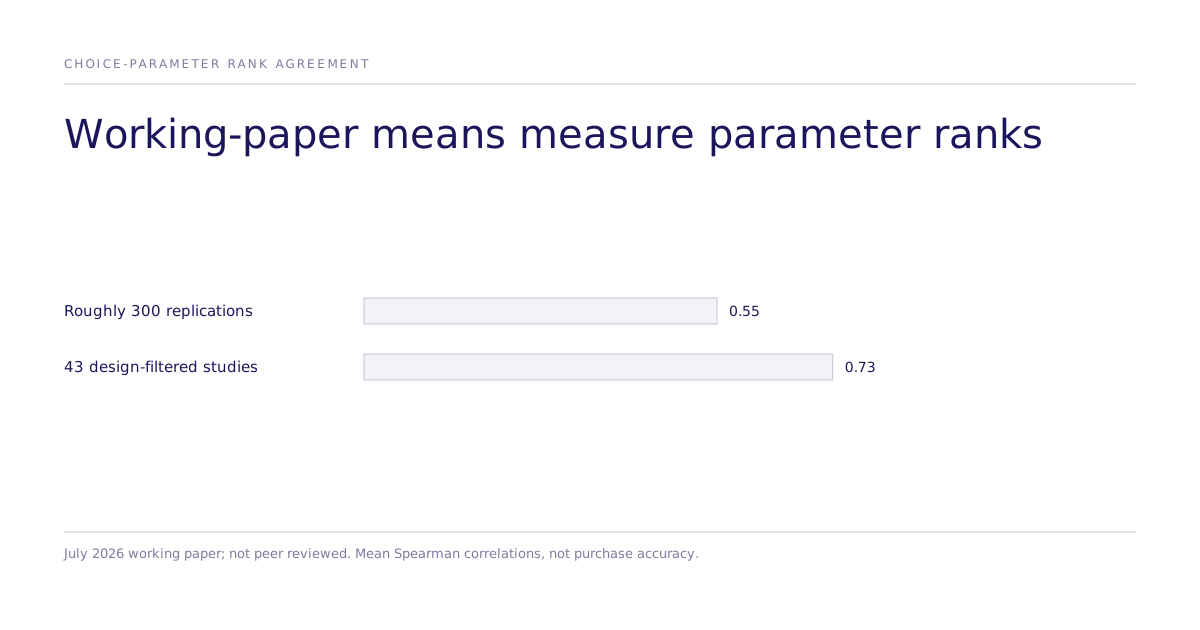
The July 2026 causal fidelity working paper, not peer reviewed, reports mean Spearman rank correlation on estimated choice parameters of 0.55 across roughly 300 replications and 0.73 across 43 studies passing design filters. These are parameter-ranking results against published human study estimates, not purchase accuracy, effect-size agreement or a human-ceiling ratio.
A public benchmark may overlap with a model's training data. Ask how the evaluation addresses contamination, whether the comparison is genuinely held out, and which human endpoint it measures. A match to published estimates alone cannot eliminate memorization risk or certify a new market.
Where do estimators fit?
Conditional or multinomial logit, Mixed Logit and integrated choice and latent variable (ICLV) models are estimators, not randomization procedures. Standard logit assumes independence of irrelevant alternatives (IIA). Mixed Logit allows preference heterogeneity and more flexible substitution, subject to its specification. ICLV adds latent constructs and measurement equations; those constructs need defensible identification and measurement assumptions.
Randomized factorial profiles can identify attribute contrasts under the assigned design. Randomization is not the only identification strategy available in research, but a fitted choice model alone does not establish a causal interpretation. Intervals from simulated respondents describe uncertainty under that simulation and fitting procedure, not unconditional uncertainty about the human market.
What validation should a buyer request?
Match the check to the decision. Parameter-rank agreement tests ordering of estimated preferences. Holdout choice prediction tests decisions on unseen tasks. Calibration checks whether predicted probabilities match observed frequencies. Purchase or revenue predictions need corresponding market outcomes, with uncertainty and the cost of errors stated.
Inspect the comparator population, task, incentives, holdout construction and failure cases. No single rank-correlation ratio is mandatory for every decision. Use the methods and validation hub for related guidance and the evidence record alongside the paper, without assuming that every study has a downloadable public run.