What is Conjoint Analysis? (with examples)
Conjoint analysis studies preferences for profiles built from varying attributes and levels. In choice-based conjoint, respondents choose among alternatives, allowing an analyst to estimate trade-offs. Ranking and rating variants use different response tasks. A product team can use these estimates to compare bundles, but stated preference is not automatically a forecast of purchases.
- Define attributes and levels that correspond to a decision.
- Use a design that supports the contrasts you want to estimate.
- Match the estimator to the response task and substitution assumptions.
- Distinguish task-level validation from external market validation.
What does a conjoint choice task look like?
Consider an invented phone study. The following prices and specifications illustrate a task; they are not measured utilities or a recommendation.
| Attribute | Phone A | Phone B |
|---|---|---|
| Camera | Standard | Enhanced |
| Battery | One-day rating | Two-day rating |
| Price | $500 | $650 |
| Choice | Select A, B, or neither | Same shared choice task |
The analyst would define the levels, vary them across repeated tasks using a randomized or balanced factorial design, and check that prohibited combinations do not destroy identification. One displayed task cannot separate camera, battery and price effects: all three differ together. Identification comes from variation across the design, with repeated observations handled at respondent level.
Suppose a fitted model assigns a higher utility to the enhanced camera while holding battery and price fixed. That contrast describes a preference under the study's task and specification. It does not mean the camera causes more purchases in a store. Interactions may matter: a camera benefit could differ by price or battery level. Estimate them only if the design and sample support them.
What other decisions can conjoint inform?
A SaaS study can vary seat limits, support terms and monthly price, with an opt-out representing the current solution. A treatment-preference study can vary administration burden, benefits and risks, using clinically meaningful levels and appropriate ethical review. These are possible applications, not claims about completed Subconscious customer studies.
A discrete-choice experiment (DCE) is a choice-task experimental design within the broader stated-preference family; it is not the name for every ranking or rating conjoint method.
How do you interpret utilities and willingness-to-pay?
Utilities depend on coding and scale, so report the reference levels and model specification. Attribute importance also depends on the tested range: including a much wider price range can change its relative importance without changing a person's underlying preferences.
In a model with a linear price coefficient, an attribute's marginal willingness-to-pay is commonly calculated as minus its coefficient divided by the price coefficient. A near-zero or unstable price coefficient makes that ratio unreliable. Name uncertainty, heterogeneity and the tested price range; do not extrapolate freely beyond it. Hypothetical willingness-to-pay can differ from actual payment, and no universal correction multiplier applies.
Which estimator fits the task?
| Estimator | Assumption to examine | Best for |
|---|---|---|
| Conditional or multinomial logit | Independence of irrelevant alternatives (IIA) and utility specification | A transparent baseline when substitution assumptions are defensible |
| Mixed Logit | Distribution of preference heterogeneity and identification | Flexible substitution and heterogeneous tastes |
| ICLV | Latent-variable measurement and structural assumptions | Joint modeling of measured attitudes and choices |
Mixed Logit and ICLV are estimators, not randomization mechanisms. Randomized factorial profiles can support assigned attribute contrasts under the design assumptions. Observational causal strategies also exist, with their own identification requirements. Adding a latent attitude does not automatically establish why a preference changed.
What would make a launch prediction credible?
Hold out tasks to check choice prediction, without using those tasks to tune the final model. Then compare with the endpoint needed for the decision. Predicting a held-out survey choice is different from predicting a purchase, signup or retention outcome. Report calibration, economic consequences of errors, and population differences as appropriate.
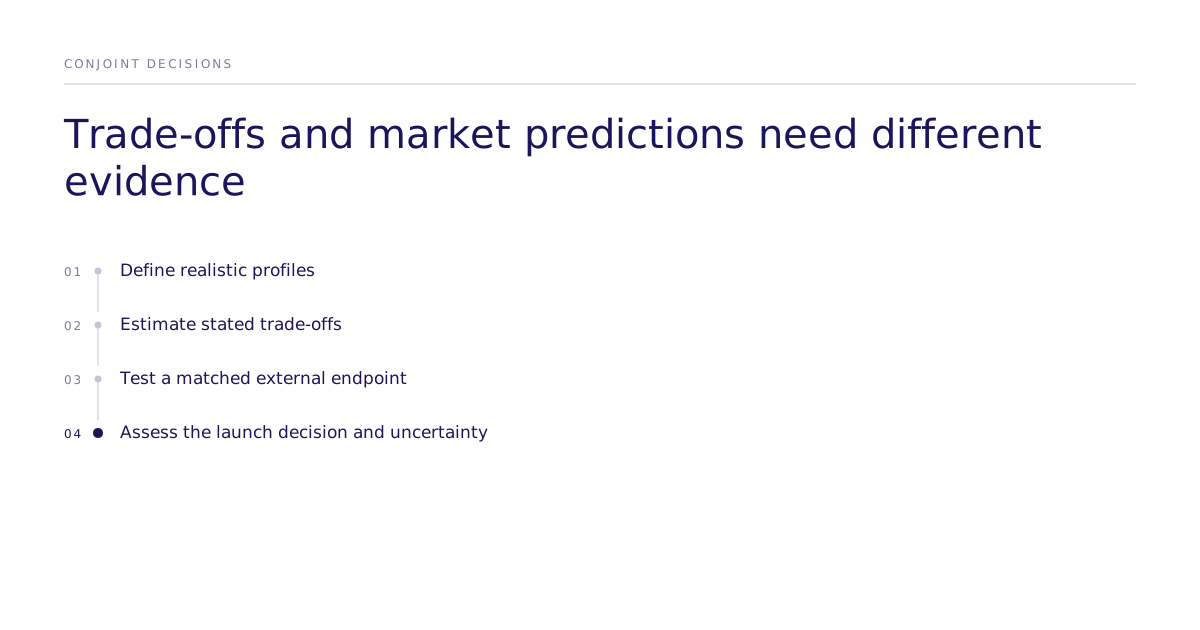
The July 2026 causal fidelity working paper, not peer reviewed, compares estimated choice-parameter rankings from model-generated replications with published human study estimates. It reports mean Spearman correlation of 0.55 across roughly 300 replications and 0.73 across 43 studies passing design filters. Those means measure rank agreement, not effect-size agreement, purchase accuracy or a human-ceiling ratio. Human comparators can themselves be stated experimental choices.
Generated choices are modeled stated choices. Randomization inside a configured simulation identifies contrasts there; transfer to people requires matched evidence. Public studies may overlap with model training data, so benchmark agreement alone cannot exclude contamination. Intervals computed from simulated respondents are conditional on that simulation and analysis, not unconditional bounds on market demand.
Before making a launch decision, document which finding is descriptive, which contrast is identified, and which forecast has external support. The methods and validation hub covers related design questions; the evidence record accompanies the published paper without guaranteeing public artifacts for every run.