Van Westendorp Templates: Uses and Limits for Pricing Decisions
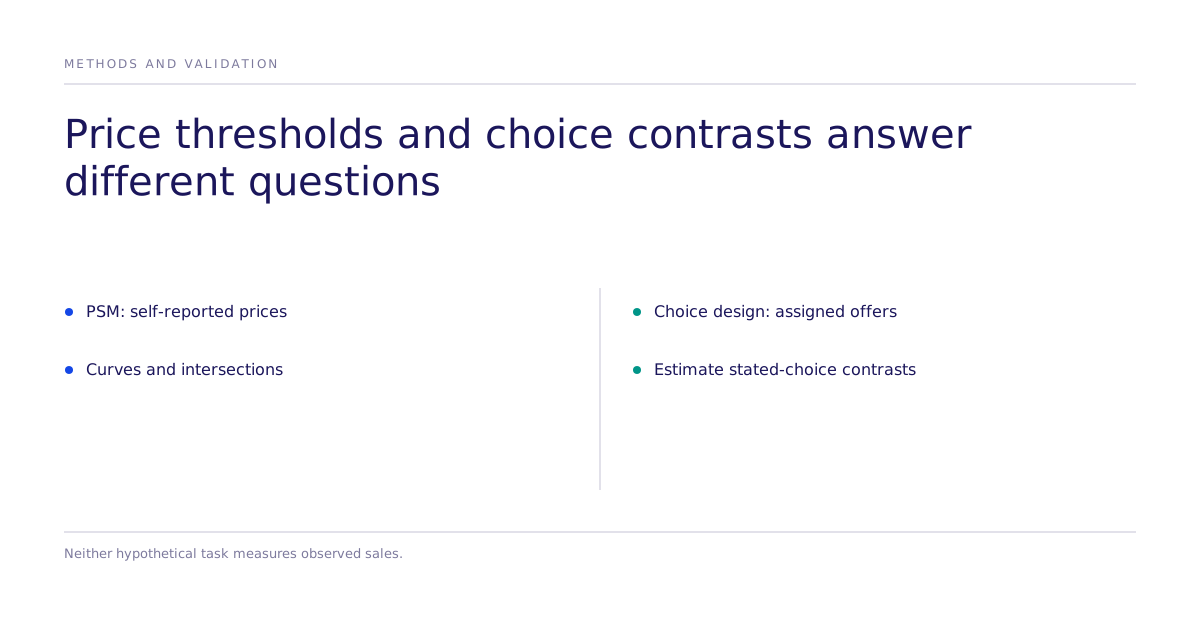
A Van Westendorp Price Sensitivity Meter (PSM) template turns four self-reported price thresholds into cumulative curves and intersections. A pricing team can use the result to frame candidate prices. The intersections do not identify demand, profit or the sales effect of changing a price.
- Specify the product, quantity, currency, billing period and audience before asking for prices.
- Check inconsistent price orders, missing values, weights and intersection conventions.
- Keep sampling uncertainty separate from hypothetical bias and model assumptions.
- Choose subsequent research around the outcome you need: stated tradeoffs or realized purchases.
Where can you get an Excel template?
Conjointly's PSM template page, updated December 29, 2023 and checked October 2, 2026, advertises an Excel workbook with a multivitamin example and states that free signup is required to download it. Its instructions map four respondent columns to too cheap, cheap, expensive and too expensive. Check the signup and download conditions before planning an account-based workflow.
The open-source R package pricesensitivitymeter, checked October 2, 2026, is an analysis alternative, not an Excel template. Its documentation covers inconsistent-response filtering, weighting and the Newton–Miller–Smith extension. Do not assume a spreadsheet and an R analysis agree until their settings and data treatment match.
What do the four curves mean?
Ask respondents at what price the described product seems too cheap to trust, inexpensive or a bargain, expensive but still worth considering, and too expensive to consider. These are judgments about the offer, not observed purchases. Keep the description constant and make taxes, delivery fees and recurring charges explicit where relevant.
In the conventional PSM calculation, too-cheap and cheap shares decline as the candidate price increases; expensive and too-expensive shares increase. Crossings yield named price points:
| Named output | Interpretation to check | What it does not establish |
|---|---|---|
| Lower acceptable bound | The selected lower intersection convention | A hard lower bound on actual demand |
| Upper acceptable bound | The selected upper intersection convention | A hard upper bound on sales |
| Indifference price point | Crossing of cheap and expensive curves | Equal utility among competing products |
| Conventionally named optimal price point | Crossing of too-cheap and too-expensive curves | Revenue or profit maximization |
The lower and upper bounds define a conventionally acceptable range. Names such as “optimal” describe the method's intersection rule, not a business optimum. Check the software's precise definitions, including any complemented curves, inclusive or exclusive thresholds and interpolation between observed prices. Different grids or crossing rules can change the reported number.
What should you check before interpreting a range?
A basic order check is too cheap ≤ cheap ≤ expensive ≤ too expensive. Decide whether ties are allowed, how missing answers are handled and whether inconsistent rows are excluded. Report exclusions and compare results with and without them; silent filtering can change which audience the analysis represents.
If weights represent the target population, calculate curve shares using those weights and document their origin. Preserve respondent-level records when bootstrapping the analysis, then recompute curves and crossings for each resample. A crossing may be absent or ambiguous in a resample; report that rather than forcing a value. A narrow resampling interval does not remove hypothetical bias or prove population coverage.
The Newton–Miller–Smith extension adds purchase-intent questions to the PSM framework. Its modeled purchase-intent output remains distinct from observed sales. Use the package's documented inputs and conventions rather than interpreting four price thresholds alone as a demand curve.
Is the bias always upward?
No universal direction is established here. Strategic lowballing can pull responses down; hypothetical overstatement can pull stated willingness to pay above consequential purchases; reference prices and unfamiliar descriptions can shift answers either way. The relative influence depends on the audience, elicitation and offer.
A matched validation study is needed to assign a direction or magnitude to your PSM error. Compare the same offer and population with a consequential outcome where possible, and report differences without assuming all stated-price methods share one correction factor. The acceptable range is a descriptive result, not a causal estimate made valid by accurate spreadsheet arithmetic.
How does a choice experiment differ?
A discrete choice experiment (DCE) is a task design. It can vary price and other attributes in product profiles, including competing alternatives and a no-purchase option where appropriate. A factorial conjoint design is valid when its contrasts, support and analysis are specified. A single-factor price experiment is also valid for a narrower question.
Mixed Logit and integrated choice and latent variable (ICLV) models are estimators, not randomization procedures. Standard multinomial logit assumes independence of irrelevant alternatives (IIA), which fixes relative odds between two alternatives regardless of the remaining choice set. Mixed Logit can relax IIA through taste heterogeneity. ICLV does not automatically remove every substitution restriction; its implications depend on the choice and latent-variable specification.
Random assignment identifies the assigned contrast under the experimental assumptions; credible observational identification is also possible under explicit assumptions. Neither method turns stated choice into realized purchase. In a simulation, assigned contrasts concern modeled stated choice within the configured model. Human or live transfer requires matched evidence. Any interval must name the estimator, sampling unit and uncertainties it includes.
What does the public simulation evidence establish?
The July 2026 causal fidelity working paper, not peer reviewed, reports mean Spearman rank correlation on estimated choice parameters of 0.55 across roughly 300 replications and 0.73 across 43 studies passing design filters. This is parameter-rank agreement, not price accuracy, effect-size agreement or a purchase forecast. Published studies may have appeared in model training; a claimed holdout needs a contamination assessment.
Use the research evidence page to inspect the available record and the methods hub to compare designs. For a pricing decision, carry the PSM range forward as candidate prices, then select a test that measures the required outcome. An actual purchase experiment needs a feasible assignment, exposure definition, follow-up window and adequate power; a stated-choice task answers a different question.