Feature Prioritization: Frameworks, Tools, and Evidence
Feature prioritization helps a product manager decide which features deserve the next release by comparing their expected value and delivery effort. Start with RICE when reach and effort can be estimated consistently. Use a value-versus-effort matrix for early triage. Choose a tool around the missing evidence: customer requests, product usage, or the likely response to an unbuilt feature.
- RICE makes assumptions inspectable: record reach, impact, confidence, and effort beside the evidence behind each input.
- Productboard, Jira Product Discovery, and Canny organize prioritization work: choose according to your feedback and planning workflow.
- Behavioral analytics helps locate existing friction: a funnel shows where customers drop out; an experiment tests whether a proposed change improves the outcome.
- Pre-build choice research compares alternatives: use the result to decide what to test or build next, with real-customer validation proportional to the cost of being wrong.
Which feature-prioritization framework should you use?
Set the business objective first: for example, increase new-account activation this quarter. Separate contractual obligations, security fixes, and prerequisite work from discretionary features before scoring. A low score cannot cancel an obligation or remove a dependency.
| Framework | How it ranks work | Main judgment required | Best for |
|---|---|---|---|
| RICE | Reach × impact × confidence ÷ effort | Comparable reach periods, impact scales, and effort units | Best for: comparing opportunities against one outcome |
| Value versus effort | Places work on a value/effort matrix | What counts as value and what delivery actually costs | Best for: an early shortlist with limited data |
| MoSCoW | Groups requirements into Must, Should, Could, and Won't for this cycle | Which requirements are essential to the release | Best for: negotiating scope against a fixed deadline |
| Kano | Classifies how feature presence or absence relates to satisfaction | Customer responses to having and lacking each feature | Best for: distinguishing expected capabilities from potential differentiators |
Intercom's RICE guide defines the scoring inputs. Productboard's framework guide describes the other approaches. Kano typically uses customer questions; RICE can use existing research and analytics without commissioning another survey.
For RICE, use one time horizon and count the eligible population. Keep confidence separate from impact. Confidence is a judgment about the evidence supporting the estimate; it is not a statistical confidence interval. Document strategic overrides alongside the score so the next planning review can reconstruct the decision.
Which feature-prioritization tools fit the evidence you need?
The table compares specific workflows, using vendor documentation checked in September 2026. Best-for guidance is our assessment. These tools can work together; an analytics chart, feedback board, and experiment answer different parts of the same roadmap question.
| Tool or approach | Evidence and workflow | What to check before choosing | Best for |
|---|---|---|---|
| Productboard | Prioritization matrices connect feature value and effort to an objective | Can your team maintain the evidence behind each value estimate? | Best for: product teams organizing opportunities around customer needs |
| Jira Product Discovery | Configurable fields and formulas support scoring and comparison of ideas | Agree on field definitions before comparing teams' scores | Best for: teams that want configurable prioritization in the Jira ecosystem |
| Canny | Connects roadmap items with customer feedback and associated revenue | Inspect whose requests are represented and which segments are missing | Best for: teams turning incoming feature requests into a roadmap |
| Amplitude Funnel Analysis | Measures completion and drop-off along defined product-event sequences | Check event coverage and distinguish observed friction from its cause | Best for: locating opportunities in an existing product |
| Subconscious | Controlled experiments on simulated populations compare proposed alternatives before commitment | Define the choice, target population, and human validation needed for the decision | Best for: testing customer trade-offs among unbuilt alternatives |
| Spreadsheet | Keeps scores, evidence links, owners, and assumptions together | Assign an owner to update stale estimates | Best for: a small team with a manageable shortlist |
Sources: Productboard prioritization, Jira Product Discovery fields, Canny roadmaps, and Amplitude funnel analysis. See Subconscious experimental design for the research approach.
Start with the workflow you already use. Add a tool when it supplies missing evidence or removes a recurring coordination problem. Buying a new scoring interface leaves an unsupported impact estimate unsupported.
How can better evidence change the roadmap order?
Illustrative example: all figures below are hypothetical planning inputs, not customer results or Subconscious performance claims. A SaaS team can fund one two-person-month project. Its objective is new-account activation. The finalists are custom dashboards and guided setup.
Use the same quarterly cohort for both features. Impact is an ordinal planning score: 1 for medium and 2 for high. Confidence is entered as a fraction. The resulting RICE score is a relative priority, not projected revenue or a count of additional activated accounts.
| Candidate | Initial reach | Impact | Confidence | Effort, person-months | Initial RICE |
|---|---|---|---|---|---|
| Custom dashboards | 1,200 | 2 | 0.50 | 2 | 600 |
| Guided setup | 1,200 | 1 | 0.50 | 2 | 300 |
The first ranking puts dashboards ahead. Before committing, the team checks feature eligibility and watches target customers attempt setup. The eligibility check shows that only 300 of those new accounts would have dashboard access during the quarter. Repeated setup problems in the usability sessions give the team more confidence in the guided-setup opportunity; it raises that planning judgment to 0.80. The sessions have not measured an activation lift.
| Candidate | Revised reach | Impact | Confidence | Effort, person-months | Revised RICE |
|---|---|---|---|---|---|
| Custom dashboards | 300 | 2 | 0.50 | 2 | 150 |
| Guided setup | 1,200 | 1 | 0.80 | 2 | 480 |
The arithmetic is explicit: dashboards score 300 × 2 × 0.50 ÷ 2 = 150; setup scores 1,200 × 1 × 0.80 ÷ 2 = 480. Guided setup now leads. It would still score 300 at the original 0.50 confidence, above dashboards' revised 150, so the decision survives that confidence judgment.
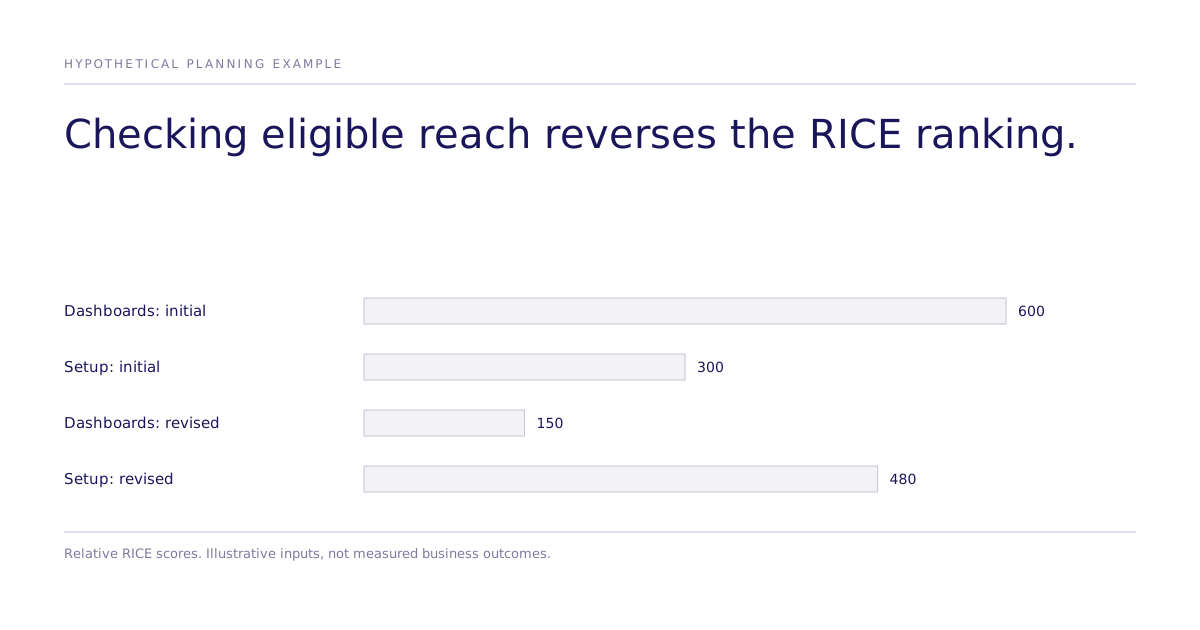
The business consequence is a different use of the same engineering capacity. Prototype guided setup next, then test activation against the current flow with eligible accounts randomly assigned. Predefine the activation event, observation window, and guardrail metrics before running the test. Record the measured effect and its uncertainty before widening rollout.
When does a choice experiment help prioritize unbuilt features?
When the uncertainty concerns which product bundle customers would choose, a randomized choice experiment can vary feature combinations while holding the rest of the offer consistent. Include a relevant current-product or no-purchase option. Estimate how the alternatives change choice within the studied population.
A simulated experiment can help shortlist bundles for human research or a live test. Its estimates describe the simulation; translating them into real adoption requires validation against the target market. Choice probabilities alone do not establish retention or revenue lift. For willingness-to-pay questions, account for hypothetical bias; for multinomial logit, assess whether its independence-of-irrelevant-alternatives assumption suits the alternatives. Report what any interval covers, including whether it excludes simulation-to-human mismatch.
Subconscious supports this pre-commitment research step. Review the published methodology, or bring a specific feature trade-off to a session. Keep the study result beside the roadmap score so the team can see which assumption changed and why.