How to manually calculate partworth utilities
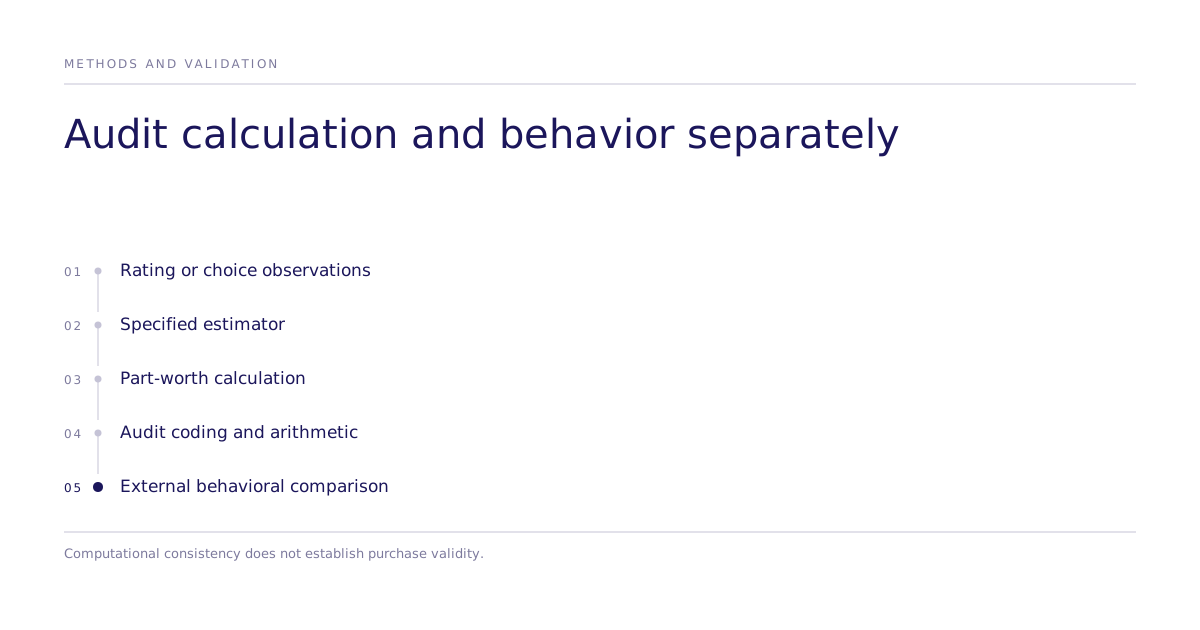
Buyers evaluating a conjoint vendor's output have one real decision to make: whether to trust the part-worth utilities enough to act on them, not whether the underlying regression ran correctly. You can manually calculate partworth utilities from a rating-based (CVA) study in three steps: compute each attribute's utility range from the regression coefficients, zero-center the part-worths within each attribute, then rescale across attributes to get relative importance. A number without its limits is marketing. Publishing this one lets a buyer check it against the data itself. That check verifies the reported coding, contrasts and rescaling; auditing the fit also requires the model, estimation settings and diagnostics. It says nothing about whether the preferences it recovered are the ones respondents would actually act on.
- The manual process is standard: compute attribute-level utility ranges, zero-center part-worths within each attribute, rescale across attributes for relative importance.
- Rating-based CVA can use OLS when its design and assumptions support it. CBC uses choice likelihoods; hierarchical Bayes can pool information to estimate sparse individual preferences.
- Correct arithmetic verifies coding and reported contrasts. It does not establish the full inference procedure or behavioral validity.
- A Swiss naturalization study compared vignette and conjoint formats against actual voting outcomes. The best-performing design evaluated paired profiles with separate accept/reject responses.
- An aggregate research benchmark does not validate a buyer’s own part-worth estimates; inspect the matched human or behavioral comparison.
How do you manually calculate partworth utilities?
For a rating-based study, fit a model to coded attribute levels, then center each attribute’s utilities and calculate its range. Relative importance is each range divided by the sum of ranges (part-worth calculation reference).
Here is an invented balanced example with price and service levels. Let expensive price and premium service be dummy variables, with cheap price and basic service as the omitted reference levels.
| Expensive price | Premium service | Rating |
|---|---|---|
| 0 | 0 | 5 |
| 0 | 1 | 6 |
| 1 | 0 | 3 |
| 1 | 1 | 4 |
The fitted rating is 5 - 2 × expensive + 1 × premium. Price utilities [0, -2] center to [1, -1]; service [0, 1] centers to [-0.5, 0.5]. Their ranges are 2 and 1, so relative importance is 2/3 for price and 1/3 for service within these tested levels. Centering preserves fitted contrasts; it does not turn utilities into purchase probabilities. A CBC choice model uses a different response likelihood and requires an explicit choice set.
Why most CBC studies use hierarchical Bayes instead of OLS
Sparse CBC tasks can leave individual preferences weakly estimated. Hierarchical Bayes pools information across respondents through a population distribution. Aggregate choice models can still be fitted to pooled observations, and randomized conjoint contrasts can be estimated for an aggregate population. The choice among these approaches depends on the response type and estimand; it is not a general failure of aggregate OLS to converge.
Auditing the arithmetic vs validating the preferences
These are different checks, and a buyer who only runs the first one has not touched the second.
| Manual arithmetic check | Behavioral validation | |
|---|---|---|
| What it confirms | Reported coding, centering, contrasts and importance arithmetic are internally consistent | The resulting preferences correspond to choices made outside the survey instrument |
| What it can't confirm | Whether respondents' stated preferences reflect what they'd actually do | Anything beyond the population and design the benchmark was measured against |
| Evidence required | Design matrix, response data and reported coefficients; a full fit audit also needs likelihood, priors where used, estimation settings and diagnostics | An independent behavioral benchmark: real referendum results, a holdout human study, purchase data |
| Best for | Buyers confirming a vendor didn't make a computational error | Buyers deciding whether to act on the result |
What does a correct part-worth calculation actually prove?
A correct regression proves arithmetic, and saying that plainly lets a buyer separate it from a claim about behavior. It proves the arithmetic is right, not that the preferences are real. Reverse-engineering a vendor's coefficients and finding they "check out" confirms internal consistency between the estimator and the input data. It says nothing about external validity, which is whether the input data (the choices respondents made in a survey) resembles the choices those same people would make outside it. A buyer who stops at the spreadsheet has validated the layer of the claim that was never in question. The layer that matters, whether the recovered preferences predict real behavior, sits one step further out and requires a different kind of check entirely.
Do conjoint results predict real-world behavior?
Hainmueller, Hangartner, and Yamamoto’s 2015 PNAS study compared single and paired vignette/conjoint formats, forced choice, and a student sample against Swiss naturalization voting. The paired design with separate acceptance or rejection of each profile performed best. The study did not compare ranking against rating tasks. Its transport result is specific to the tested domain and samples.
Where does the say-do gap hide inside a correct regression?
A number on its own is marketing. Publishing where it fails is what lets a buyer verify it. It hides in the survey responses themselves, before the estimator ever runs, which is why no amount of recomputation catches it. Hypothetical responses may differ from actual behavior, with the direction and size depending on the task, incentives and population. Validate the stated-choice result against evidence for the intended behavior. A part-worth calculation has no step that detects this. It takes whatever the respondent said as ground truth and transforms it faithfully. The transformation can be flawless and the ground truth can still be wrong.
How does Subconscious validate part-worths against real behavior instead of just the math?
A buyer evaluating Subconscious should inspect the randomized attributes, identified contrast, choice-model assumptions, and matched human result. Mixed logit can represent taste heterogeneity; an integrated choice and latent-variable model does not automatically remove independence-of-irrelevant-alternatives restrictions.
For a proposed part-worth study, request the stimulus, level coding, estimator, uncertainty, and predeclared human agreement criterion. The published research and validation approach provide context; neither guarantees that this study’s preferences predict purchases.
A validation using public historical data also needs an assessment of training overlap. Prospective or otherwise held-out evidence is stronger for a new market question. See the methods hub.
Audit the coefficients and tested level ranges, then ask what external behavior the preferences were compared with. Match that evidence to the actual task and population. Discuss a study protocol before commissioning a pricing decision.