Mini-lecture: Conjointly's guide to inflation
Conjointly’s inflation mini-lecture, dated December 13, 2021, discusses pricing research under rising costs. For a pricing leader, the next question is which measured quantity supports the proposed price move: perceived inflation, stated willingness to pay, randomized stated choice, or actual purchases. Each requires a different interpretation.
- The historical lecture discusses sentiment tracking and pricing instruments such as Van Westendorp, Gabor-Granger, and conjoint.
- Inflation perceptions can influence responses, but evidence of perception bias does not establish bias in a particular pricing task.
- A randomized choice task can identify effects within that task; realized demand elasticity requires suitable behavioral evidence.
- Human agreement and uncertainty should be evaluated for the actual price range and population.
- Next step: name the price move you actually need decided this quarter, and price a randomized test of it before committing budget to another sentiment read.
What Conjointly's mini-lecture gets right
Sentiment tracking describes perceived price pressure. Pricing surveys describe responses to their tested offers and tasks. A conjoint study can include randomized prices; that identifies a stated-choice contrast under the design assumptions. None of these outputs should be relabeled observed demand without a matching transaction or incentive-aligned test.
What sentiment trackers and stated-preference tools can't tell you
ECB working paper 2642 reports systematic differences between inflation perceptions and measured inflation, including attention to price increases. Those perceptions may influence a pricing response. Whether they bias a particular Van Westendorp or choice study requires task-specific evidence. Hypothetical budget constraints and actual payment remain separate conditions.
Why separate inflation monitoring from demand measurement?
A faster sentiment read can reveal changing price perceptions. It does not establish how a particular SKU’s quantity sold responds to its price. Track costs and perceived inflation for context, then evaluate the proposed product price against the appropriate choice or purchase endpoint.
Can a language model replace the consumer panel?
The June 2026 Bank of England working paper by Anesti, Hill, and Joseph studies inflation attitudes using primarily GPT-3.5 Turbo. It tunes against 2022Q4 data and tests on 2023Q1, reports 95% intervals for coefficient comparisons, and evaluates economic-information treatments. It finds some household regularities and aggregate alignment, alongside weak individual correspondence and inconsistent inflation reasoning. These checks do not establish product-level price elasticity.
Measure the price effect within the right endpoint
Randomize the tested price or attributes when the design permits causal identification. A human survey or simulated DCE then estimates an effect on stated or modeled choice within that task. A choice model translates those observations under its assumptions; it does not remove hypothetical bias. To estimate realized demand elasticity, use a suitable transaction experiment or validate against observed purchases, including availability, competitor offers, and the tested price range.
| Sentiment tracker | Stated-preference pricing study | Randomized experiment, discrete choice model | |
|---|---|---|---|
| What it measures | Perceived inflation | Stated price tolerance or choice | Effect on the specified randomized endpoint |
| Output | Perception index or trend | Task-specific price response | Choice or purchase effect with justified uncertainty |
| Identification | Descriptive unless designed otherwise | Depends on instrument and randomized variation | Depends on assignment and design assumptions |
| Limitation | Perception may differ from measured inflation | Hypothetical choices may differ from purchases | Stated or simulated endpoints require behavioral validation |
| Best for | Monitoring perceived pressure | Screening and trade-off research | Testing a specific price within a defined endpoint |
How much should a buyer trust a simulated elasticity?
For elasticity, report the proportional change in quantity relative to the proportional price change, the baseline price, uncertainty, and whether quantity is modeled choice or realized purchase. Rank agreement on choice parameters cannot validate the magnitude of that elasticity. Ask for a matched price-task result before approving the SKU move.
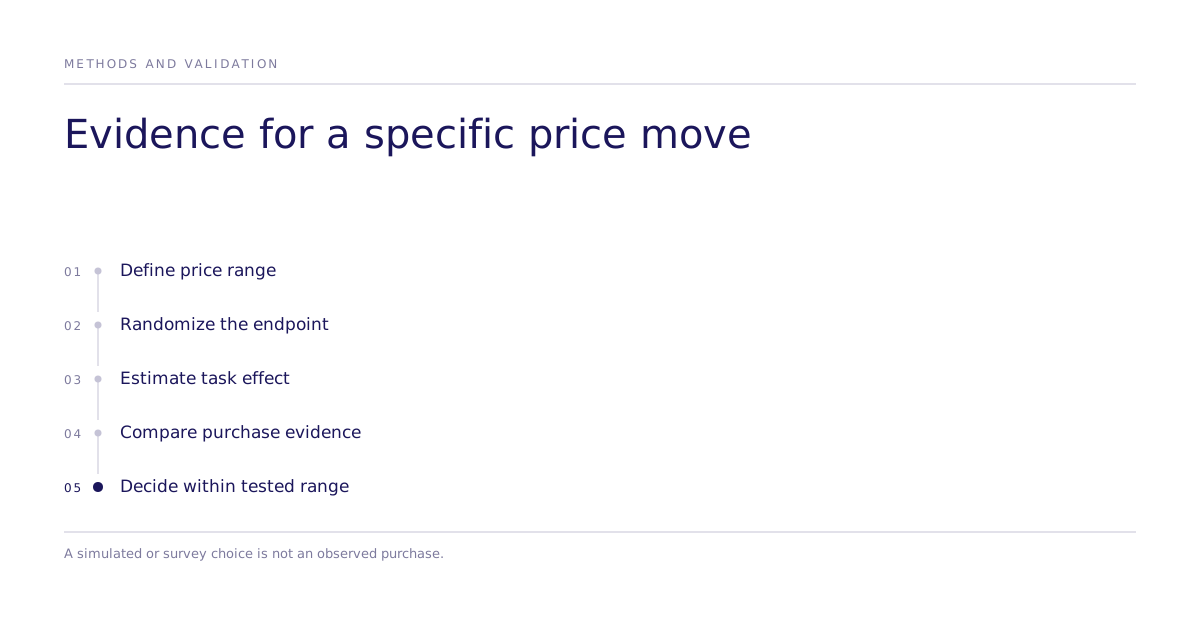
A human agreement test should preserve the price range, choice set, audience, and endpoint and report failures as well as agreement. Public historical benchmarks can overlap training data, so prospective or otherwise held-out evidence matters. Inspect the validation approach and research for scope.
Define the exact price change, margin objective, and demand endpoint before choosing the instrument. Use the methods hub to scope the study, or discuss the decision. Keep the final recommendation within price ranges and outcomes supported by evidence.