Mini-lecture: Conjointly's guide to sample selection
A research director needs two checks: enough information for the intended estimate and a respondent pool appropriate to the population. A sample-size heuristic does not establish power, respondent identity, attention, or behavioral transport. Current vendor quality procedures should be evaluated alongside the design’s statistical requirements.
- The Johnson rule is a rough level-exposure heuristic for aggregate CBC: n ≥ 500c/(ta), excluding a none option from alternatives.
- Academic discrete choice experiments show no real consensus on N: a systematic review of healthcare DCEs found sample sizes from 10 to 3,727, median 294.
- Pew’s 2021 samples showed different descriptive benchmark errors; a new panel needs its own quality evidence.
- Sample information, identity, attention, representativeness, and behavioral validation are separate checks.
- A human or behavioral comparison tests agreement for its endpoint; it does not guarantee future performance.
What does the sample-size heuristic establish?
Sawtooth’s Johnson heuristic is n ≥ 500c/(ta): respondents n, tasks t, alternatives a excluding none, and maximum attribute levels c for main effects. More tasks or alternatives generally increase level exposure at fixed n; more levels reduce exposure per level. The heuristic does not calculate a target interval or design-specific power. Suggested starting counts such as 300 overall or 200 per subgroup need adjustment for contrasts, interactions, response quality, and precision requirements.
Why does academic practice show such a wide range of "right" sample sizes?
Because there isn't one right sample size, only a right size for a given effect and a given population, and researchers disagree on both constantly. A systematic review of discrete choice experiments in healthcare found published sample sizes ranging from 10 to 3,727 respondents, with a median of just 294 (PMC). That spread is not evidence of sloppiness. It reflects that the "correct" N depends on the effect size researchers expect to detect, the design's efficiency, and how finely they plan to slice the results. What the spread does undercut is the idea that a single formula, applied mechanically, settles the sample-selection decision. Johnson's rule and the 300-respondent default are reasonable starting heuristics, not proof that a study's findings are real once the target N is hit.
Why does sample size say nothing about whether your respondents are real?
Pew’s 2023 report compares six samples fielded in 2021, totaling 29,937 U.S. adults, against 28 population benchmarks. Opt-in samples had roughly twice the average absolute benchmark error of probability samples in that comparison; this is not a universal panel multiplier. Westwood's PNAS survey-agent study reported attention-check evasion in 99.8% of 6,000 tested agent trials. That result concerns the agents and checks tested; it does not measure fraud prevalence in every panel. A panel audit should examine layered screening rather than infer human identity from attention checks alone.
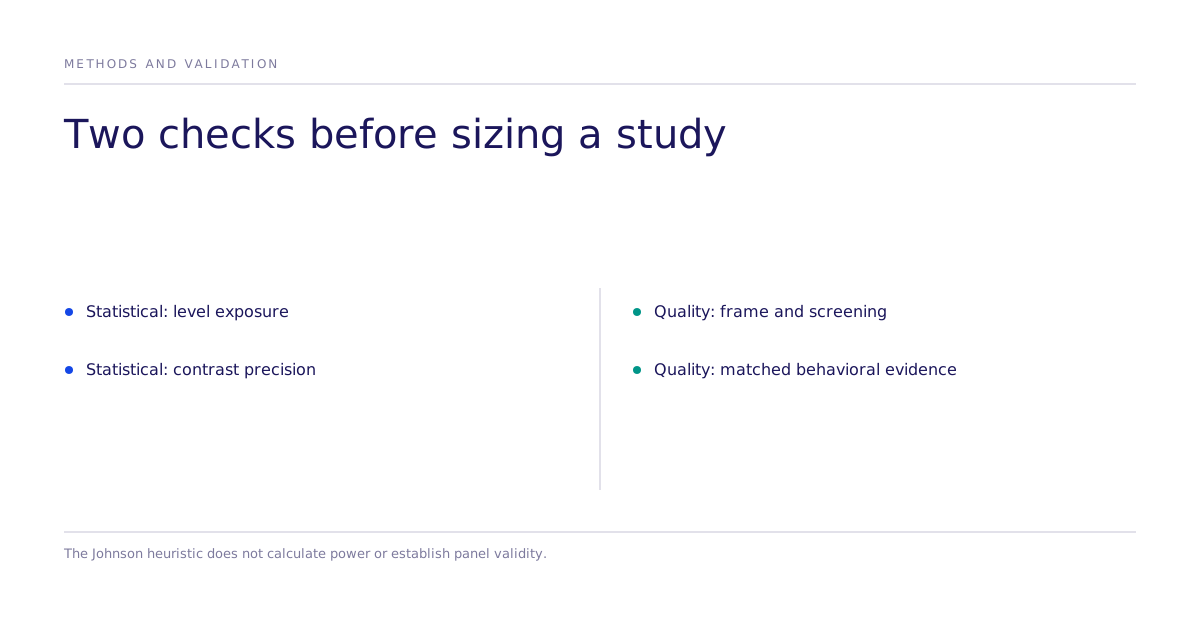
Sample size versus sample reality
These are two separate audits, and a buyer needs both before trusting a result.
| Sample-size question (Johnson's rule, 300 default) | Sample-reality question (panel and validation audit) | |
|---|---|---|
| What it checks | Rough exposure of attribute levels; power needs a separate design-specific calculation | Identity, attention, sampling, and endpoint-specific human or behavioral agreement |
| Where the gap shows up | Sparse contrasts, interactions, and subgroup estimates | Fraud, nonresponse, coverage gaps, and hypothetical behavior |
| What a bigger N fixes | Can improve precision under the actual sampling/design assumptions | Does not automatically remove systematic bias or fraud |
| Best for | Deciding how many tasks and respondents a design can support | Deciding whether the study's causal effect is worth acting on |
What does causal validation check that a sample-size formula can't?
For a simulated choice study, randomization identifies a contrast within the simulated response process under design assumptions. A matched human or behavioral test then examines transport. Mixed logit represents heterogeneous preferences; ICLV is a model specification and does not automatically relax IIA.
For sample selection, request a design-specific uncertainty or power calculation and a matched quality audit. A rank-correlation benchmark is a different measure from directional agreement, correct outcomes, or interval coverage. Evaluation holdout does not itself exclude foundation-model training exposure. Inspect the research and the actual study’s prospective or otherwise held-out comparison.
A decision checklist for a sample-selection call
- Use the Johnson heuristic as an exposure starting point, then calculate information and precision for the actual contrast and subgroup plan.
- Ask whether the panel is probability-based or opt-in, how it represents the population, and what matched benchmark evidence supports its quality.
- Ask what stops an AI agent from completing the survey as a human; standard attention checks no longer do this reliably.
- Ask whether the resulting preference estimates have been checked against real human behavior, not just internal statistical consistency.
- For willingness to pay, inspect hypothetical-bias evidence for the task; do not apply a universal direction or correction factor.
Where does this leave a buyer choosing between guides?
Conjointly’s current panel-quality documentation describes screening, soft launches, automated fraud checks, and manual review. Sawtooth also discusses representativeness and poor data. These procedures matter, but none alone proves behavioral transport for the buyer’s endpoint. Ask for both the quality record and the study-specific validation. See the methods hub.
Next step: before running a new choice study, pull the panel's own quality documentation and ask two questions directly, what share of respondents failed an attention check in the last quarter, and how the panel screens for AI-generated responses. If you want a second opinion on a specific market or design, meet the team.