Models for calculating preference shares
A preference-share forecast depends on both the estimated utilities and the rule converting utilities into choices. First Choice, logit Share of Preference, Randomized First Choice, and Purchase Likelihood can produce materially different levels and substitution patterns. Audit estimation, aggregation, holdout calibration, and uncertainty before using shares for a launch.
- Compare utility validity and share-rule calibration together; neither automatically validates the other.
- Randomized First Choice was built specifically to fix the red-bus/blue-bus failure of flat logit models and outperformed rival share rules in Sawtooth's own 2016 holdout competition, a vendor-run test on Sawtooth's own 21 holdout tasks (Sawtooth Software, Randomized First Choice).
- Choice-task observations are data. Mixed logit and ICLV are model specifications; hierarchical Bayes is one estimation framework.
- Synthetic respondents can receive randomized offers. That identifies effects within the simulated response process; human transport is separate.
- A parameter-rank benchmark does not establish market-share or substitution accuracy for this competitive set.
What are the models for calculating preference shares?
First Choice selects the highest-utility option for each respondent. Logit Share of Preference normalizes exponentiated utilities across the set, with scale affecting predicted shares. Randomized First Choice adds configured random errors before repeated choices. Correlated attribute errors can relax IIA; a product-error-only configuration can reduce to logit. Purchase Likelihood scores alternatives independently and needs separate calibration before interpreting absolute probabilities. Sawtooth’s RFC documentation describes the configuration and its vendor-run holdout comparison.
For an invented logit example, utilities log(2) and 0 yield shares 2/3 and 1/3. Adding a copy of the second alternative gives 1/2, 1/4, and 1/4. The first product loses share even though the new product resembles only the second. Test that substitution pattern, utility scale, and the outside option on relevant holdouts; the arithmetic alone does not establish market demand.
| Model | How it aggregates shares | IIA-sensitive? | Best for |
|---|---|---|---|
| First Choice | Winner-take-all per respondent | Less sensitive at the individual level, but volatile with small samples | Simple competitive sets where you mainly need a directional winner |
| Share of Preference (logit) | Probabilistic split by relative utility | Yes, fully bound by IIA | Fast, well-separated product sets with little overlap between alternatives |
| Randomized First Choice | Configured error plus repeated first-choice draws | Can relax IIA with correlated attribute errors; product-only errors can equal logit | Similar products when holdout calibration supports the configuration |
| Purchase Likelihood | Independent purchase-probability score per product | No, it scores products independently, not as a fixed-pool share split | Category-expansion or new-product-entry questions, not fixed-pool share splits |
Why do utilities and the share formula both matter?
Randomized attributes can identify effects on choice under the experiment’s conditions. A survey or simulation remains hypothetical unless real incentives or purchases are explicitly part of the task. Choice data, the utility model, the estimator, and the share rule are separate decisions. No aggregation rule removes input bias or establishes external validity.
Does Randomized First Choice fix the red-bus/blue-bus problem?
RFC can reduce unrealistic substitution when correlated errors represent similarity between attributes. Its behavior depends on error components and scale. Sawtooth’s red-bus/blue-bus example explains the issue. Validate the configured model on relevant held-out tasks or observed shares; its name alone does not establish the correction.
Where do the utilities come from, and why does that decide the outcome?
Utilities can be estimated from choice-task observations using different model and estimation frameworks. Hierarchical Bayes pools information when individual tasks are sparse; aggregate estimation is also possible. Check the design’s randomization and endpoint separately from the estimator. Hypothetical willingness to pay needs task-specific behavioral calibration.
What does randomization establish for synthetic respondents?
A randomized synthetic choice experiment can estimate an intervention effect within that simulated process. Human choice agreement and realized market outcomes remain separate checks. A narrow simulator interval does not bound human transport error or future market demand.
The causal-fidelity working paper reports mean Spearman correlations on estimated choice-parameter ranks. Those are not market-share accuracy or human-ceiling ratios. For a share forecast, request calibration and substitution results for the actual alternatives and population.
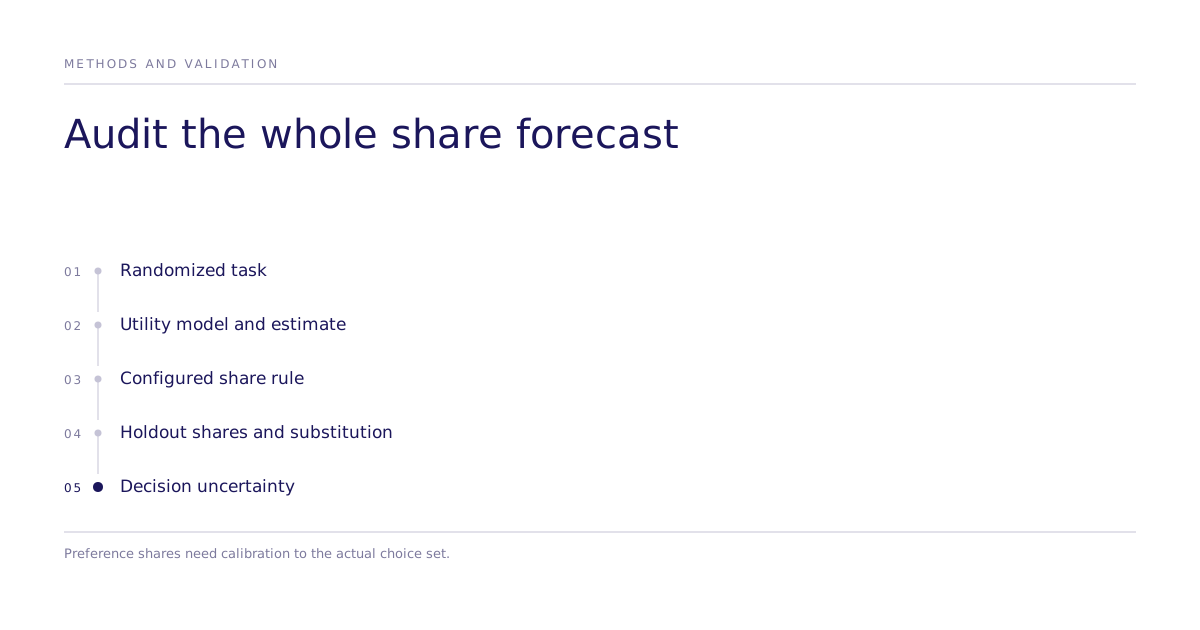
Aggregate methodology and choice-parameter-rank results: causal-fidelity working paper. Its per-study replication data are not public.
Historical public studies may overlap foundation-model training data. Holding an evaluation study out of analysis is not proof that it was absent from pretraining. Prefer prospective evidence or document the remaining overlap risk. Inspect the validation approach.
How should a senior buyer decide?
Request held-out share error, substitution behavior, uncertainty, and the population and choice set used for calibration. Compare RFC error settings and logit scale against those holdouts. Treat Purchase Likelihood as a distinct absolute-probability task. See the research and methods hub.
Ask what happens to predicted shares when a close substitute enters, and compare that prediction with relevant human or market evidence. Discuss the competitive set before using its forecast to allocate launch spend.