Pareto/NBD: Finding Silent Churn Before It Shows Up in Revenue
A customer who buys on demand, not on a contract, never clicks "cancel." They just stop. By the time a revenue report shows the drop, the budget window to win them back has usually closed.
The Pareto/NBD model exists to catch that customer earlier. It estimates, from purchase history alone, which buyers are still active and which have likely already gone quiet.
What the model separates
Pareto/NBD couples two mechanisms. This summary draws on the PyMC Labs Pareto/NBD implementation:
- A purchasing process: while active, purchases follow a Poisson process, so short gaps between orders are more likely than long ones.
- A dropout process: the time until a customer goes inactive follows an exponential distribution, modeling the silent churn that non-contractual businesses never observe directly.
Customer purchase and dropout rates vary across the population, conventionally with Gamma distributions and independence assumptions. Rates are stationary within the model’s window. Check temporal holdout purchase forecasts and calibration before relying on alive probabilities; changing seasonality or promotions can violate the assumptions.
Schmittlein, Morrison, and Colombo introduced the model in a 1987 paper that asked how a business could identify its individual buyers and forecast what each one would purchase next (Management Science, 1987); later work extended it with hierarchical Bayesian estimation (Marketing Science) and a simplified alternative formulation (Marketing Science). It remains the reference model for non-contractual, continuous-purchase settings: grocery, retail, subscription-adjacent commerce with no cancellation event.
What does Pareto/NBD need, and what does it give back?
The model runs on four fields already sitting in a purchase-history table: a customer_id, frequency (repeat purchases), recency (time of the most recent purchase), and T (time since first purchase). No survey, no additional tracking, no new instrumentation.
In return it produces four estimates for each customer:
- Expected purchases over a future window.
- Probability the customer is currently active ("alive probability").
- Probability of making an exact number of purchases in a future window.
- Expected purchases for a brand-new customer with no history yet.
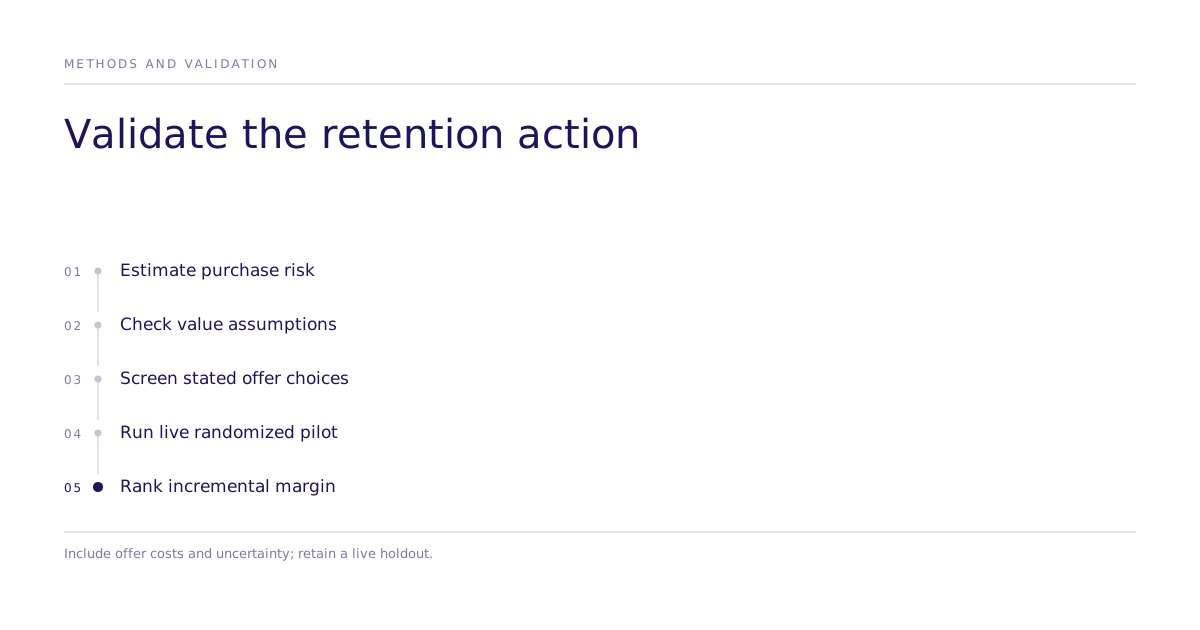
High historical frequency and low alive probability can identify a candidate for investigation, not a retention priority. Rank interventions by expected incremental contribution margin net of offer and delivery cost, with uncertainty. A departed customer may be less recoverable than an active customer whose behavior can still change.
What does Pareto/NBD not tell you?
A model's output means something only when its boundaries are stated alongside it. Pareto/NBD predicts purchase occurrence and churn risk. It does not estimate monetary value; that requires pairing it with a separate model such as Gamma-Gamma. Its purchase process assumes continuous time in a noncontractual setting. Contractual businesses can observe cancellation and need a model suited to that information. Discrete-time purchase opportunities can still be noncontractual; Fader, Hardie and Shang's BG/BB model addresses that separate setting.
Purchase history may include discounts, emails, or credits. The fitted occurrence model’s summaries do not identify their causal effects. Randomized assignment, or a defensible observational design using treatment and confounder data, is needed to estimate whether an intervention changes repeat purchases.
Where the two methods connect
A choice experiment can screen stated preferences for candidate offers in the relevant segment. Before claiming a retention effect, run a live randomized pilot measuring actual repeat purchases, margin, and offer cost against a holdout. Pareto/NBD risk, customer value, and intervention response are separate inputs.
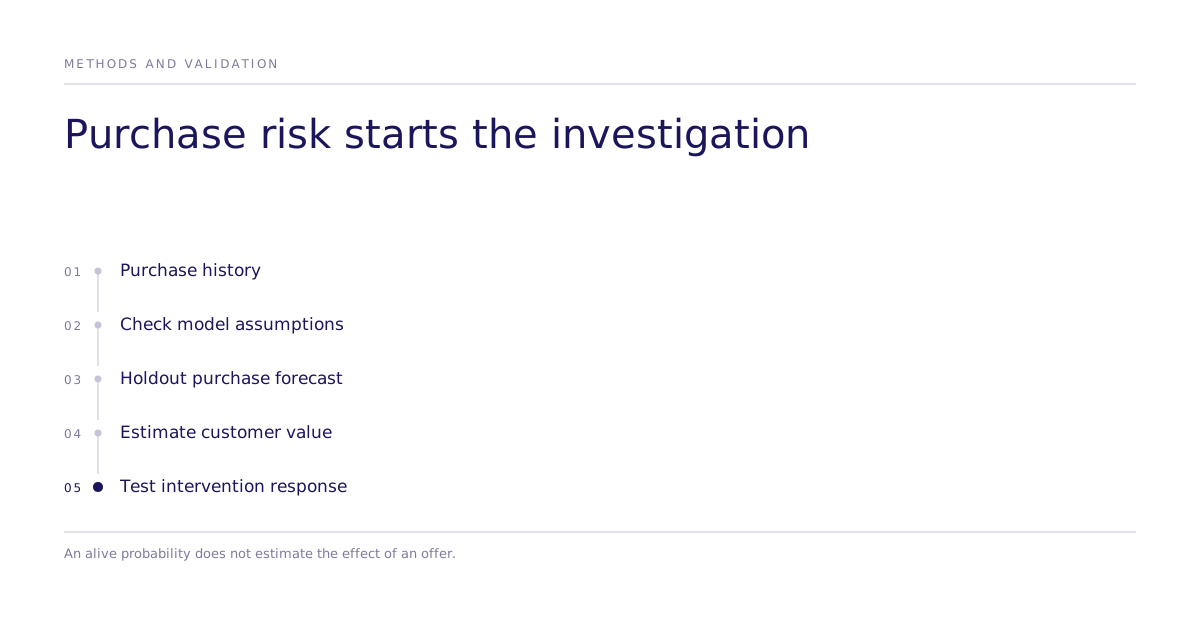
Where does Pareto/NBD fit in a retention workflow?
Use Pareto/NBD as the triage step: it works directly on purchase logs a business already has. It answers "who is at risk," not "what should we do about it" or "how much are they worth." Pair it with a monetary model for value, and with a causal test for the intervention decision itself.
Related reading
Explore causal behavioral research methods or see how validated studies move from simulation to real participants.