How to perform smart sampling and data checking?
A sampling protocol needs separate evidence for precision, respondent quality, identification, and transport. Attention checks provide screening signals; sample-size heuristics concern information. Neither guarantees human identity or a causally valid market estimate.
- Passing a screen reduces some risks but leaves possible false negatives and false positives.
- Westwood's PNAS survey-agent study reported attention-check evasion in 99.8% of 6,000 tested agent trials. This concerns the tested agents and checks, rather than the prevalence of automated responses in every panel.
- NORC’s 2026 narrative review summarizes heterogeneous studies and industry estimates. Fraud, unusable responses, and exclusions need separate definitions and denominators.
- Pew’s 2016 comparison has a newer six-sample comparison published in 2023; sample errors must retain their population and metric.
- Exposure heuristics do not establish power, parameter truth, or behavioral transport.
What a data quality check is actually testing
A screening protocol asks whether responses show evidence of duplication, inattention, implausible access, or automation. Validate its sensitivity, false-positive rate, and residual contamination on the target questionnaire. A separate analysis asks whether the sampling and experimental design support the intended estimand.
Does passing a bot check mean your data is valid?
Passing a bot check is evidence from that check, not conclusive verification of identity or attention. It also does not validate the relationship between hypothetical choice and later purchases.
Pew’s 2016 benchmark reported larger errors for some subgroup estimates; the above-10-point figures were not an overall error for every respondent. Its 2023 comparison evaluates six 2021 samples against 28 U.S. benchmarks. Neither certifies all respondents as fraud-free. AAPOR’s task force finds no single framework covering all nonprobability methods, while allowing model-based inference when its assumptions are justified.
Why fraud-free panels still produce biased answers
Selection, nonresponse, measurement, and contamination can all contribute to error. Screening targets some contamination risks; population adjustment requires justified assumptions, and hypothetical-to-real behavior needs endpoint-specific evidence. Do not attribute all benchmark error to one cause without identification.
What do DCE sample-size rules of thumb leave out?
Sample-size rules provide rough planning guidance. They do not guarantee coefficient precision. Calculate power or interval precision for the specified effect, design, sampling process, and analysis. More data can reduce variance under assumptions while leaving systematic bias.
| Approach | What it tells you | What it misses |
|---|---|---|
| Rule of thumb | Rough exposure or planning guidance | Target power, identity, representativeness, and transport |
| Formal power calculation | Detection probability for a specified effect under assumptions | Fraud, measurement bias, and untested behavioral transport |
| Matched human or behavioral validation | Agreement for a specified endpoint and metric | Identity certification or guaranteed future-market agreement |
What evidence supports a causal choice claim?
Randomization or another defensible identification strategy supports the task-level causal contrast. A matched human or behavioral test evaluates agreement and can fail. Parameter-rank correlation is distinct from direction, magnitude, interval coverage, or purchase prediction. Public historical data may overlap training data; a leaderboard does not itself prove exclusion from pretraining.
Multinomial logit, mixed logit and ICLV are choice-model specifications. Request the actual estimation and uncertainty procedure separately. Identification depends on the randomized manipulation and design assumptions; estimation fits the specified model to the observed choices. A simulator interval describes uncertainty under its stated response-process and analysis assumptions, with coverage requiring checks. It does not bound human transport error or future market outcomes; those require matched external evidence.
How do you build a sampling and checking protocol that catches both problems?
Run fraud screening and causal validation as two separate steps. They catch two different failure modes.
- Screen for bots and inattentive respondents with layered detection, not a single attention check. Standard attention checks no longer catch AI-generated responses reliably (CloudResearch).
- Size the study with a formal power calculation tied to the effect size that matters for the decision, not a rule of thumb like n=300.
- Before trusting the output, check whether the design and estimator have been replicated against a real, held-out human study, and ask for the replication rate, not just the fraud rate.
- Evaluate hypothetical-bias risk and incentive alignment for the specific willingness-to-pay task.
- For substitution, inspect IIA and calibrate the configured model on relevant holdouts. Mixed logit can represent heterogeneous tastes; ICLV does not automatically remove IIA.
More on how the estimators and validation protocol fit together: methods and validation.
Where willingness-to-pay estimates still mislead
Overstatement of willingness to pay is a documented risk of hypothetical tasks, not a universal outcome for every study. Check payment consequences, budget constraints, task design, uncertainty, and a matched purchase or incentive-aligned comparison. Magnitude disagreement is a separate issue from identity or statistical precision.
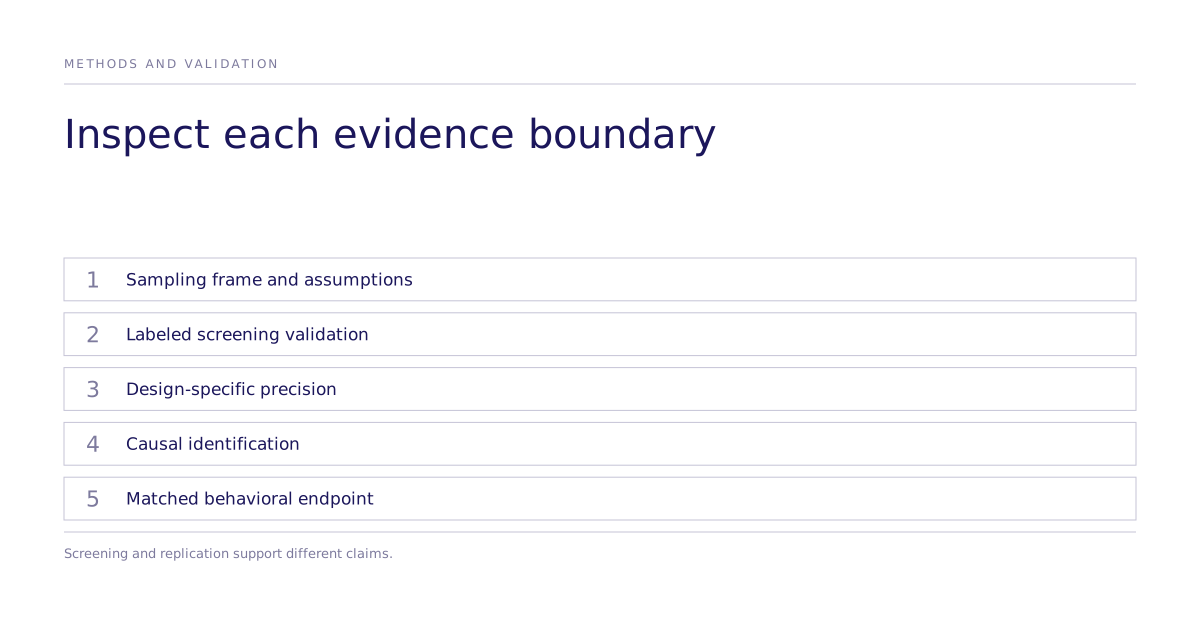
Review the last study’s sampling frame, labeled screening validation, design-specific precision, identification strategy, and matched endpoint evidence. For a protocol review, inspect the validation approach or book time.