Sample Size Calculator and Guide to Survey Sample Size
This guide links sample-size calculators and explains when their proportion formulas apply. Choosing a sample size requires the intended estimand, sampling design, precision, and analysis assumptions. A choice-utility study needs design-specific information; a calculator does not establish behavioral validity.
- The linked SurveyMonkey and Creative Research Systems calculators support proportion planning; under independent simple random sampling, p = 0.5 and 95% confidence with a 5-point margin imply 385 after rounding up.
- Sawtooth’s CBC rule is an aggregate exposure heuristic, not a universal 300-person floor or a design-specific power calculation.
- Larger samples do not automatically remove selection, measurement, or hypothetical-behavior bias.
- A matched validation test examines agreement for the task and can fail.
- The public research protocol discusses choice-parameter comparisons; parameter-rank correlation is not a binary replication rate.
What a sample size calculator actually tells you
For an independent simple random sample estimating one proportion, use n0 = z² p(1-p) / e², with confidence quantile z, expected proportion p, and absolute margin e. If p is unknown, p = 0.5 is conservative. With z = 1.96 and e = 0.05, n0 = 384.16; round up to 385. For finite population N, use n = n0 / (1 + (n0-1)/N) when the sampling assumptions support that correction. Account for nonresponse separately. Clustered or weighted designs need a justified design effect, and nonprobability inference needs an explicit model; the simple formula does not establish its coverage.
Why conjoint and discrete choice studies need a different formula
For main-effect aggregate CBC exposure, the Johnson heuristic is n ≥ 500c/(ta), where a excludes a none option. More levels, interactions, small subgroup contrasts, and individual utility estimation can require different information. Sawtooth’s suggested starting counts are not mandatory floors. The DCE sizing guide discusses power calculations tied to the intended effect and analysis.
How many respondents do you need for a discrete choice experiment?
With 4 tasks, 3 non-none alternatives, and 5 maximum levels, the exposure heuristic gives n ≥ 208.33, rounded to 209. It does not prove adequate power or impose an automatic increase to 300. Size the actual design for meaningful contrasts, subgroup information, estimator assumptions, and decision uncertainty.
Three ways to size a study, compared
| Approach | What it estimates | Basis | What it can't tell you |
|---|---|---|---|
| Proportion calculator | Margin for one proportion under sampling assumptions | z, expected p, margin, population correction, design effects | Choice-model information or behavioral transport |
| CBC exposure heuristic / formal power | Exposure guidance or effect-specific power under assumptions | Actual tasks, levels, contrast, response model, and population | Identity, bias, or untested transport |
| Matched endpoint validation | Agreement and error for a defined human or behavioral outcome | Independent reference, metric, and uncertainty | Guaranteed future performance |
Best for: pick the generic calculator when you're estimating one proportion off a descriptive survey. Pick Sawtooth's rule of thumb or the PMC power method when you're sizing a conjoint or DCE and need the study to hold up statistically. Pick a causal, baseline-validated design when the decision riding on the result is expensive enough that "statistically stable" isn't the same bar as "actually true."
What a bigger sample size can't fix
A larger sample can reduce variance while leaving systematic error. Hypothetical-bias research describes context- and design-dependent differences between stated and consequential choices. Overstatement is a risk, rather than a universal direction or 2–3× correction. Distinguish contingent valuation from choice experiments and evaluate incentives and a matched behavioral comparison for the actual task.
Does a tighter confidence interval mean the preference is real?
No. A confidence interval tells you how much sampling noise surrounds your estimate; it says nothing about whether the underlying preference would hold up if people actually had to choose. This is where the sample-size question and the causal question split. A confidence interval from a simulated or fielded experiment covers the estimated effect within that specific study population, not the real market unconditionally, and a flat logit model carries the independence-of-irrelevant-alternatives (IIA) assumption, which can distort preference-share and substitution estimates when alternatives aren't truly independent, a limitation Mixed Logit is specifically designed to relax. None of that shows up in a sample size calculator's output. It shows up when you check the design against what real people actually did.
How causal validation checks a design against real behavior
A randomized design supports task-level identification under assumptions. A matched human or transaction comparison evaluates transport to that endpoint. Report error magnitude and uncertainty rather than relabeling parameter ranks as replication frequency. Assess possible foundation-model overlap with public historical references. Inspect the research and methods hub for scope.
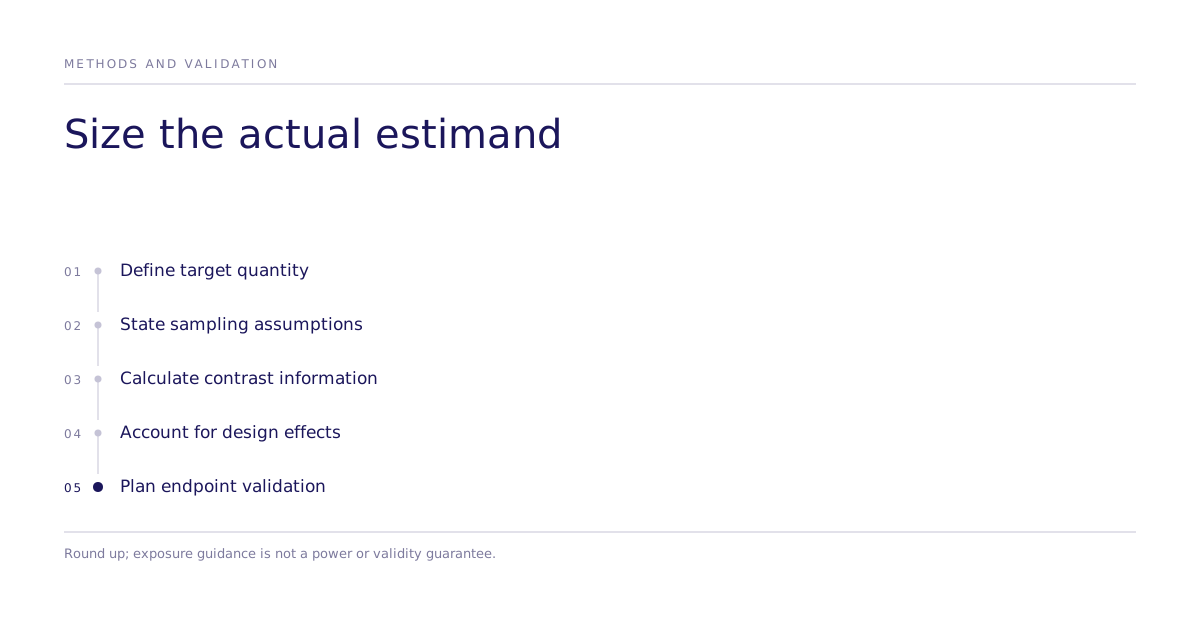
Before fielding, specify the estimand and meaningful effect, calculate information for the actual design, account for sampling and exclusions, and predeclare a validation criterion. Discuss the study if a generic calculator cannot answer that brief.