Which Causal Method Fits Your Data When a Randomized Trial Isn't Possible
A marketing or analytics leader wants to know whether a pricing change, a campaign, or a launch actually caused a shift in customer behavior. Randomized controlled trials give the cleanest answer, but a live GTM decision often can't wait for one, and sometimes randomization isn't available at all. When a team reaches for existing observational data instead, the question becomes which method fits the data shape in front of them, and what happens if the identifying assumption behind that method silently fails.
Reading a causal effect out of data you already have
Randomization can support causal identification under a specified design, with uncertainty from the finite sample. Noncompliance, attrition and spillovers can still complicate interpretation. When assignment cannot be randomized, observational designs need explicit identifying assumptions.
Two examples make the constraint concrete:
- TV advertising: individual viewing of a linear-TV spot is difficult to assign, but randomized geographic placement or encouragement may still be feasible. Check those options before concluding that randomization is unavailable.
- Environmental proximity: households cannot be randomly assigned distance from an industrial facility, yet the causal health consequence of that proximity is a real policy question.
CausalPy, an open-source package associated with PyMC Labs, supports quasi-experimental workflows. The four examples below require different data and assumptions; inspect the current documentation for the implementation you use.
Four designs, four data shapes
Each method below applies to a different data structure. Picking the wrong one doesn't produce an error: it produces a plausible-looking estimate resting on an assumption your data can't support.
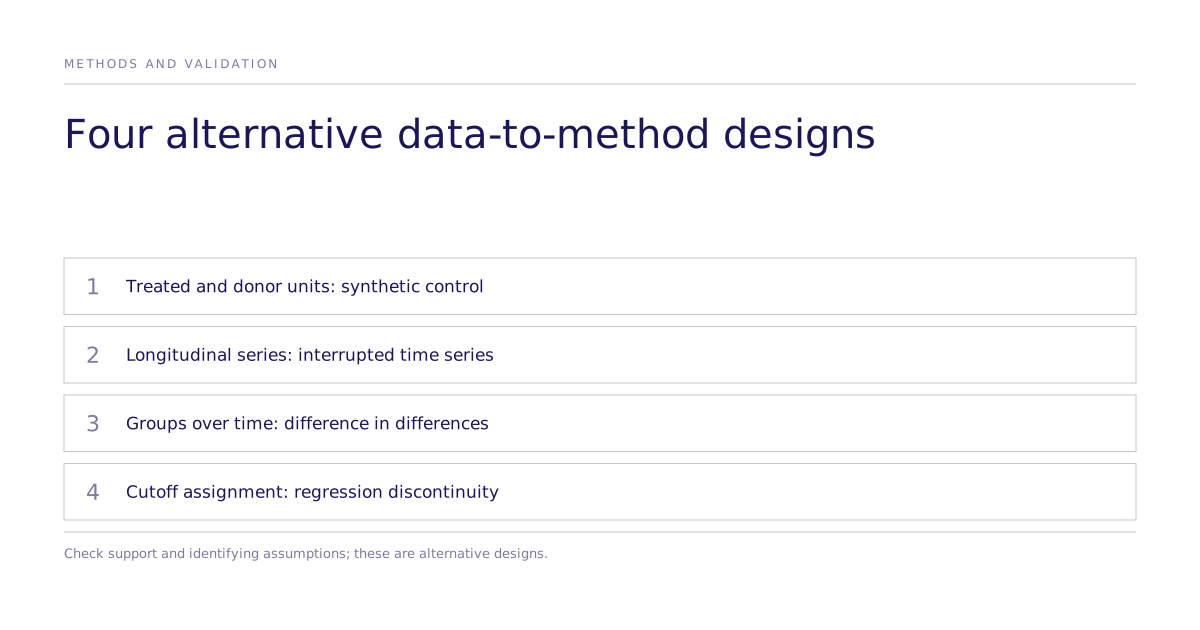
Synthetic control applies when multiple units exist and only one receives the treatment. It blends the untreated units into a single weighted composite standing in for the missing counterfactual, then measures the treated unit against that composite once the intervention begins. The gap is the estimated effect. Typical use: evaluating a change rolled out in one region, country, or business unit while others were left alone.
Interrupted time series applies when only one unit was ever treated, all you have on it is a running series of measurements over time, and there's no other group to compare against. It fits the pre-intervention trend, extrapolates it forward as the counterfactual, and compares that projection to what actually happened after the intervention. Typical use: assessing a policy change, product launch, or platform update against one tracked metric over time.
Difference in differences can use a minimum of two periods and treated and untreated groups. It compares their before-to-after changes under the parallel-trends assumption. Multiple pre-periods are needed for pre-trend or event-study diagnostics; one baseline measurement cannot provide those checks.
Regression discontinuity uses a treatment-assignment cutoff in a running variable. A local outcome discontinuity may identify a treatment effect when potential outcomes are continuous at the cutoff, no other relevant treatment changes there and units cannot precisely manipulate assignment. Check whether the design is sharp or fuzzy and how local the estimand is.
Carpenter and Dobkin's study uses the US legal drinking-age threshold to examine mortality (NBER working paper; published AEJ Applied Economics paper). The discontinuity is interpreted under the design's assumptions; a sharp jump alone is not sufficient for every cutoff.
"This increase in alcohol consumption results in a discrete 9 percent increase in the mortality rate at age 21."
Carpenter and Dobkin, NBER Working Paper 13374 (source)
Do these causal methods check their own assumptions?
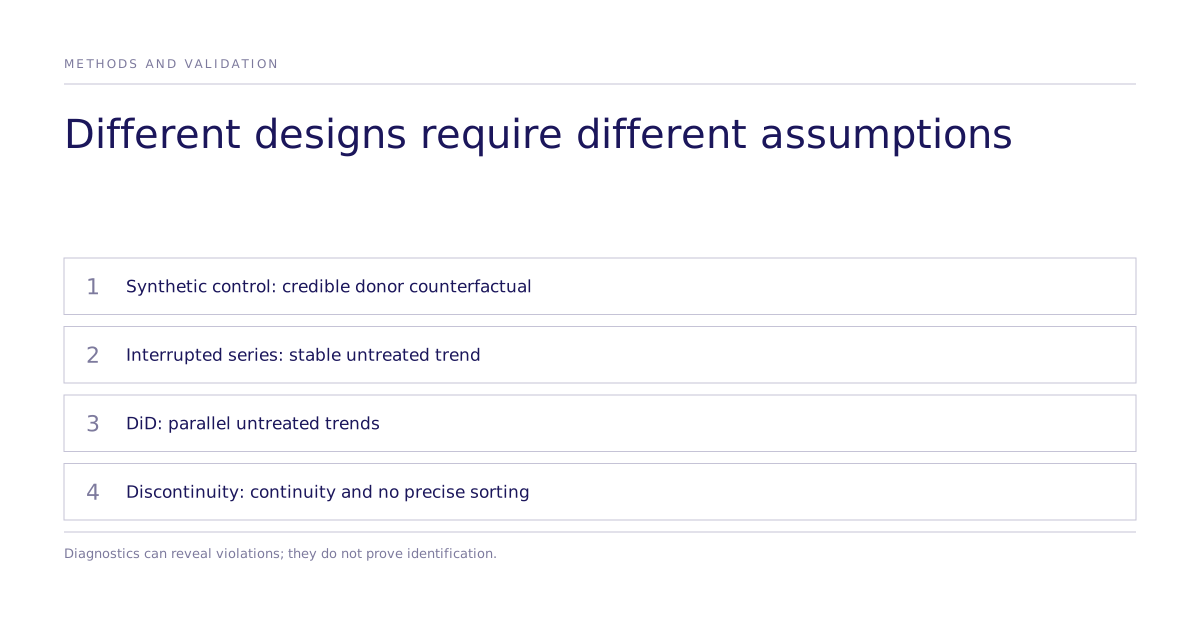
Diagnostics can reveal violations but do not prove identification. Synthetic control needs a credible donor pool, pretreatment fit and placebo or sensitivity checks. Interrupted time series needs a defensible continuation of the untreated trend and checks for concurrent changes. Difference in differences needs plausible parallel untreated trends and attention to anticipation, timing and spillovers. For regression discontinuity, a running-variable density test assesses manipulation or sorting. Check other policies at the threshold, covariate continuity, bandwidth sensitivity and placebo cutoffs separately.
Running the controlled experiment instead
A controlled choice experiment can test stated responses to randomized attributes in a defined simulated or human population. It provides a different outcome from a quasi-experimental effect on observed sales or behavior. Choose the design from the estimand and evidence available.
A quasi-experimental analysis can estimate an effect on observed behavior under its identification assumptions; a choice experiment measures responses within its assigned task. Stated and observed outcomes may differ through context and hypothetical incentives, without a universal direction. For a modeled result, specify the matched human endpoint and protocol needed to test transfer, and confirm fieldwork responsibilities.
What does Subconscious not replace?
For a proposed Subconscious engagement, confirm the analysis features and deliverables needed for the target estimand. Existing-data methods need their particular comparison groups, support and identifying assumptions; a new study needs feasible assignment and an outcome matched to the decision. Human stated-choice agreement does not automatically validate clinical outcomes, usability or market performance. Choose from the available evidence and cost of error.
Where to go next
If you're deciding between reading a causal effect out of existing data and running a controlled test before you commit budget, Subconscious's research covers how the controlled-study approach works, and how we work covers what a study looks like end to end.