9 AI Brand Awareness Tracking Tools Compared (2026)
A CMO who owns the brand-health budget faces one decision every cycle: which
signal to buy, and how often to buy it. Social listening, a recruited
real-human tracker, and a controlled experiment answer different questions.
Picking the wrong one is the expensive mistake, not the sticker price of any
single tool.
Nine tools, three question types
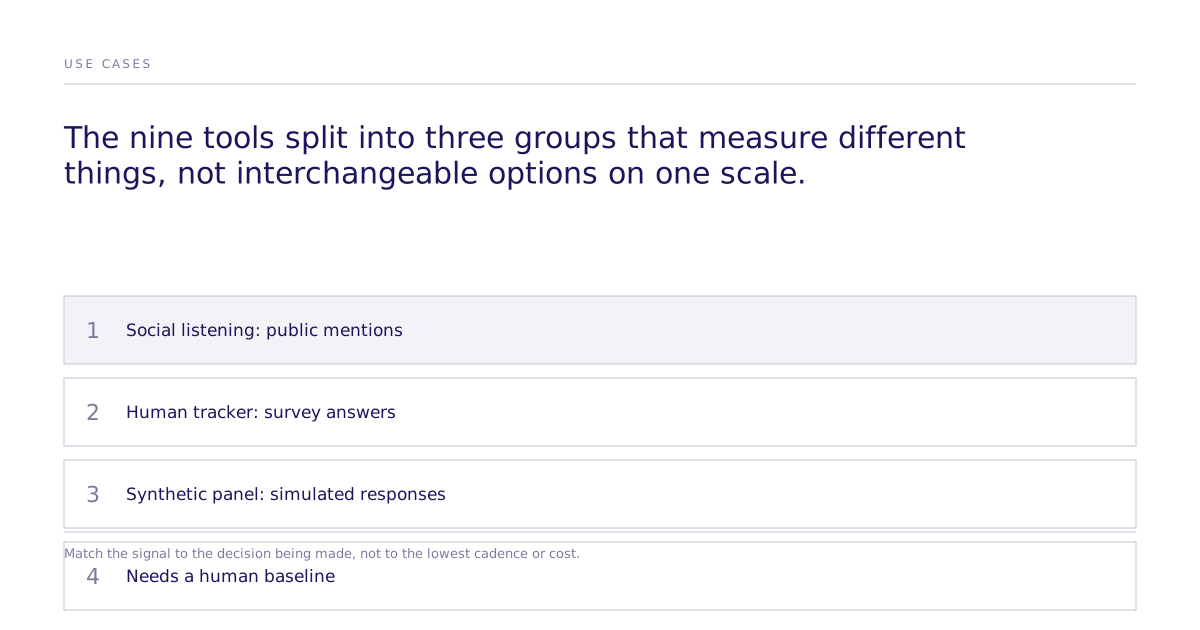
They split into three groups by what they can actually measure.
1. Self-serve synthetic panels
A calibrated panel of simulated respondents built to stand in for a target
audience, queried on whatever cadence a team chooses rather than a fixed
seasonal wave. These platforms are priced to be self-serve, so frequent,
low-stakes checks are affordable in a way an annual tracker budget cannot
support.
What Is Brandwatch?
A long-established social listening platform. It scores sentiment and
share of voice from public mentions rather than panel answers, so it
describes what people say, not what they privately believe.
3. NetBase Quid
Another social listening platform built for enterprise brand and
communications teams, in the same category as Brandwatch: real-world
mentions, sentiment, and share of voice at scale.
4. Talkwalker
A third social listening entrant, strongest for category share-of-voice
and competitive monitoring drawn from public digital conversation.
5. Latana
A recruited real-human brand tracker with automated analysis layered on
top. It is a traditional survey panel with better tooling, not a
simulated one, and it reports directly on awareness, consideration, and
preference.
6. Quantilope
An automated insights platform that runs real-human surveys at scale,
with brand tracking as one workflow among several. It fits large
programs that need recruited responses fielded on a repeatable schedule.
What Is YouGov BrandIndex?
The most established syndicated brand tracker, built on daily recruited
human responses across thousands of brands. It is the closest thing the
category has to a shared benchmark, and it is why any serious
brand-tracking review should check its published methodology before
comparing a synthetic read against it.
8. Evidenza
An audience-simulation platform where brand tracking is one of several
supported workflows, run against a synthetic panel stable enough to
query on a set schedule.
What Is Aaru?
A synthetic-panel platform built for large, statistically rigorous
population-scale brand studies, priced and scoped for enterprise
programs rather than self-serve use.
Comparison criteria
| Criterion | Social listening (Brandwatch, NetBase Quid, Talkwalker) | Recruited human tracker (Latana, Quantilope, YouGov BrandIndex) | Synthetic panel (self-serve platforms, Evidenza, Aaru) |
|---|---|---|---|
| Primary signal | Public mentions and behavior | Recruited human survey answers | Simulated responses under defined conditions |
| Typical cadence | Continuous | Daily to quarterly, fixed waves | Whatever cadence the team sets |
| Strongest use | Share of voice, issue detection | Absolute measurement, board reporting | Flexible, low-marginal-cost directional checks |
| Main limit | Unaided belief is inferred, not measured | Fielding cost caps the wave schedule | Needs a human baseline to trust the absolute number |
| Best validation check | Compare sources and coding | Sampling and questionnaire quality | Compare against a recruited human baseline |
No single row of this table settles the decision by itself.
Why the categories are not interchangeable
Social listening reads public conversation. It is strong at flagging a
sentiment shift or a share-of-voice change the same day it happens, and weak
at anything the audience thinks but never posts: unaided awareness,
consideration, and stated preference all have to be inferred rather than
observed.
Recruited human trackers ask the standard brand-health question set directly
to real people. That makes them the strongest source for an absolute number a
board can cite. The tradeoff is cadence: a quarterly wave is a practical
ceiling for most budgets, and a wave already in the field cannot bend to
capture an unplanned event.
Synthetic panels answer the same question set from simulated respondents,
on any schedule a team wants, at a materially lower marginal cost per wave.
That speed is best used for relative comparisons, such as this quarter
against last quarter or one message against another, and for directional
reads. Reporting an exact percentage of a real population from a synthetic
read alone goes further than the method supports without a human check on
that number.
Reading a vendor's own benchmark claim
Any platform in this category may publish an internal accuracy claim against
historical tracking data. Before treating one as decision-grade evidence, ask:
- Was the comparison run at the aggregate level or the individual level?
- Did it test stated preference, an observed choice, or open-ended text?
- Was the benchmark audience close to the audience the team actually needs?
- Were the prompts, calibration method, and failure cases disclosed?
- Does the platform report a range or uncertainty, or only a single number?
A claim that cannot answer most of these is a marketing figure, not a
validation result.
Running the stack instead of one tool
Teams that get the most out of this category rarely pick just one row of
the table. A repeatable pattern:
- Keep one fixed set of core measures (unaided awareness, aided awareness,
consideration, preference, brand attributes) worded identically every
cycle, so a shift is comparable across waves.
- Run a same-week check against the current decision when a competitor
launches or category news breaks, instead of rebuilding the whole tracker.
- Capture a pre-campaign baseline and a post-campaign read so a controlled
test can separate exposure from non-exposure before results are read.
- Compare narrow buyer segments cheaply through a synthetic read, then
confirm any segment that matters commercially with a human check.
- Run a recruited human wave on a fixed schedule and compare its pattern
against the synthetic signal; investigate the audience definition and
stimulus before trusting the synthetic trend if the two diverge.
Where a controlled causal test fits
None of the nine platforms above is a fit for every brand question. A
distinct fourth option is a controlled experiment: define the audience,
change one variable such as a message, a category frame, or a positioning
statement, and measure which version moves stated preference. This is not a
standing tracker and does not run on a continuous cadence; it answers one
comparison at a time.
Subconscious supports this fourth path rather than competing
with the tracking categories above. It tests which specific action causes a
measurable move in audience preference, and can validate that result with
real human participants without changing the underlying
question being asked. That is a different job from an always-on brand-health dashboard: it
answers "would this change help," not "what is our current awareness score."
A team already running one of the nine tools above can add this kind of test
before committing budget to a specific message or position, then confirm the
market outcome with continuous tracking after launch. See a worked
example of how a causal comparison is scored, or book a
walkthrough of a specific decision.