AI Customer Journey Mapping Through Touchpoint Experiments
Customer journey maps are often created once in a workshop and left unchanged. Research-based maps can be slow and static. Workshop maps can be fast but dominated by internal assumptions.
Simulation offers a third input: defined customer types reacting to specific touchpoints. The result can be updated as the experience changes, but it remains simulated evidence that should be compared with customer and behavioral data.
How long does a customer journey map take to build?
Estimate the journey study from the audience, touchpoints, evidence sources, and analysis. A workshop can generate an initial map; a research study can check assumptions using customer and behavioral evidence. Neither has a universal timeline or price.
Both methods produce a snapshot. A map from six months ago may no longer reflect a changed product, competitor, or customer context.
What audience stages should you simulate?
Define audience states such as an unaware prospect, active researcher, first-time buyer, repeat customer, at-risk customer, and loyal advocate. Do not treat one generic persona as the whole journey.
At each touchpoint, present the actual experience and probe the response. Examples include an ad, product page, first purchase, onboarding step, support interaction, or review request three months after purchase.
Record confidence, confusion, excitement, frustration, and indifference. Ask what information is missing and which action the customer would take next.
Treat simulation as a different kind of evidence
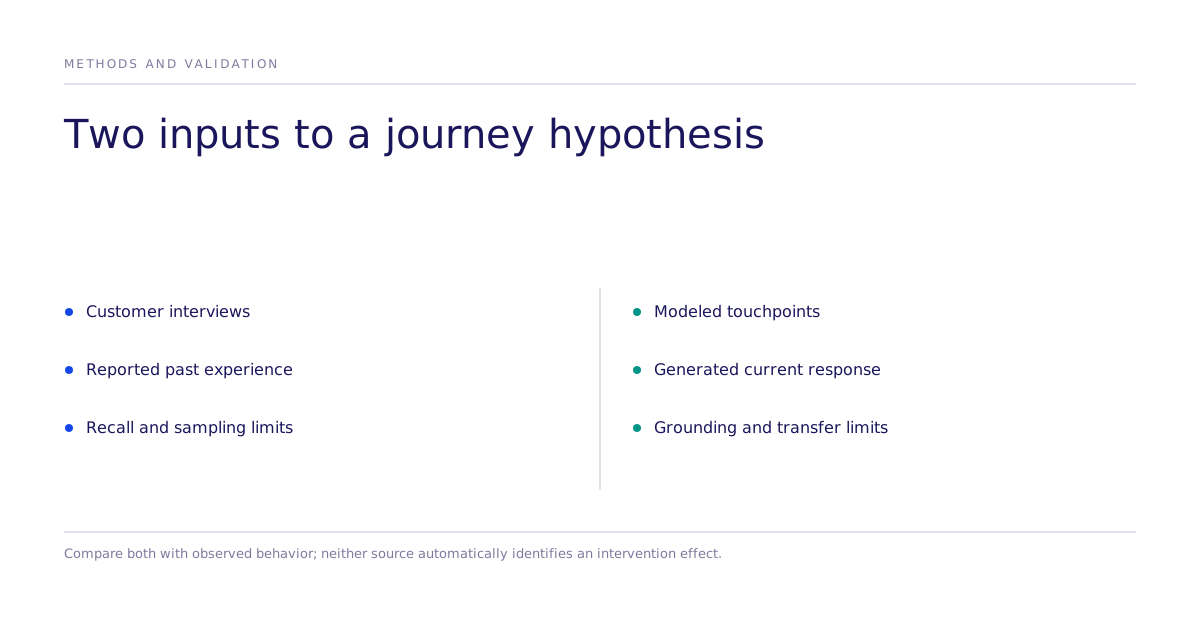
Retrospective accounts can have recall error. A health-service utilization study by Brusco and Watts compared self-reports with claims data and found under-reporting of GP visits in its sample. That health-care endpoint does not quantify recall bias in every commercial journey interview.
Simulation presents the touchpoint in the current session. It is not automatically more accurate, and it does not reveal what an actual customer did.
An illustrative update workflow
Establish the audience definitions
For an illustrative brief, define five to seven audience states across important stages. Constrain them with approved customer evidence and record where grounding is thin. A generated state is not an observed individual journey.
Inspect the touchpoints
Present relevant touchpoint stimuli and record generated responses and hypotheses. Sensory, live service, and purchase experiences require appropriate human evidence. Build the map with the assumptions visible.
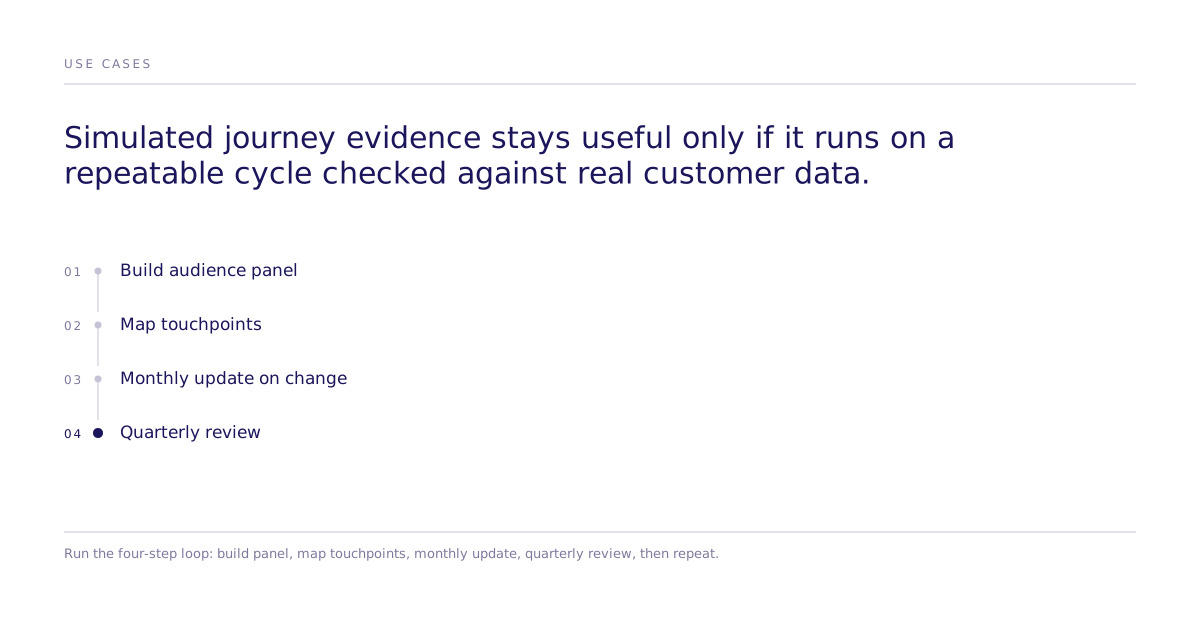
Monthly updates
When onboarding, checkout, email, or another touchpoint changes, run the same comparison again. Keep unrelated variables stable.
Quarterly review
Repeat the full journey exercise. Compare what improved, degraded, or introduced new friction.
Focus on high-value transitions
The move from awareness to consideration depends on the information and proof that starts active evaluation.
The move from first purchase to second purchase often determines whether a customer relationship develops. Study onboarding, first use, follow-up, and the next purchase decision.
The move from risk to churn requires observed warning signals such as lower use or more support contact. Use simulation to form intervention hypotheses, then test the action.
How do you connect the map to existing evidence?
NPS and CSAT record reported attitudes, analytics records activity, and support tickets describe issues raised. Simulation can suggest explanations and alternative actions. These sources differ in population and timing; check comparability before interpreting a common pattern.
Subconscious can support controlled comparisons of journey actions for a defined audience, alongside the case studies where those comparisons ran. The journey map becomes useful when each proposed change is tied to an outcome and checked against real behavior.