8 Questions to Ask Before You Trust a Segment Estimate
A quant researcher who owns a firm-characteristic return model has to
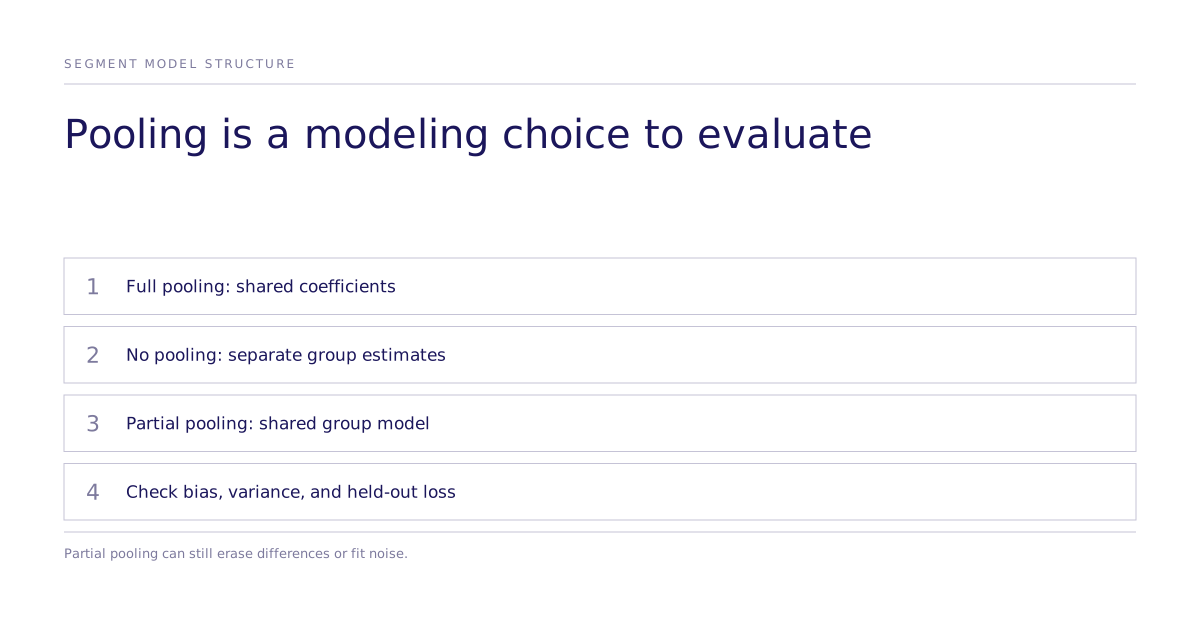
choose every time a new segment shows up in the data: report one pooled
coefficient for every sector, split the model so each sector gets its own
independent fit, or let the data decide how much a sector is allowed to
differ from the rest. Get that choice wrong and the model either erases a
real effect or mistakes noise for one, and either error changes which action
gets taken on which segment.
An applied equity analysis by PyMC Labs
by Camilo Saldarriaga and Masataka Hayashi, published April 23, 2026,
illustrates partial pooling for firm-characteristic return models. Its
simulation uses 50 observations per sector; its real-data exercise uses
sector-varying coefficients. The example motivates a modeling choice,
not a guarantee that hierarchy outperforms alternatives in a new application.
The PyMC multilevel primer
is a separate radon tutorial. It is useful for learning pooling,
but does not document this equity study or its backtest.
Any team that reports a segment-level number (by industry, by cohort, by
region) faces the same pooling decision. Eight questions worth asking before
trusting one.
1. Does one number really apply to every segment?
A pooled regression without group interactions assigns one slope per variable.
That restriction comes from the design matrix, not from LASSO or Ridge alone.
Regularized models can include group-specific terms or interactions.
Compare the pooling structure and penalty or prior separately before
deciding whether a model can represent segment differences.
2. What happens if you fit every segment in total isolation?
The opposite failure mode is no pooling: fit each segment's coefficient
independently, with no information shared across groups. Small samples can
leave group estimates unstable. Check uncertainty and held-out performance
rather than infer reliability from a detailed segment table.
3. Does a middle option exist?
Partial pooling is that middle option. Each segment still gets its own
coefficient, but that coefficient comes from a common distribution built
around a shared mean. The strength of pooling depends on data, likelihood,
priors, and the group structure. Check whether sharing information across
these particular groups is defensible; hierarchy can bias distinct groups.
4. Can the model tell you how confident it is?
Request intervals alongside coefficient summaries and ask what they cover.
A Bayesian interval is conditional on its priors and likelihood; a frequentist
interval also depends on its design and model assumptions. Narrow intervals
can coexist with omitted variables, selection bias, or regime changes.
Neither an interval nor a posterior identifies an intervention effect.
Ask which population and period the coefficient describes.
5. What does the pooling structure actually look like in code?
The hierarchical model's structure maps closely onto its mathematical form:
sector intercepts and sector-specific coefficients are drawn from
group-level hyperpriors. A non-centered parameterization can improve sampling
in some hierarchical geometries, but does not ensure stable inference.
Inspect convergence, effective sample sizes, and divergences. The No-U-Turn
Sampler is an adaptive Hamiltonian Monte Carlo method; its algorithm
does not by itself guarantee representative finite-run draws
or a correctly specified statistical model
(Hoffman & Gelman, 2014, Journal of Machine Learning Research).
6. Does the model's own prior make sense before you look at data?
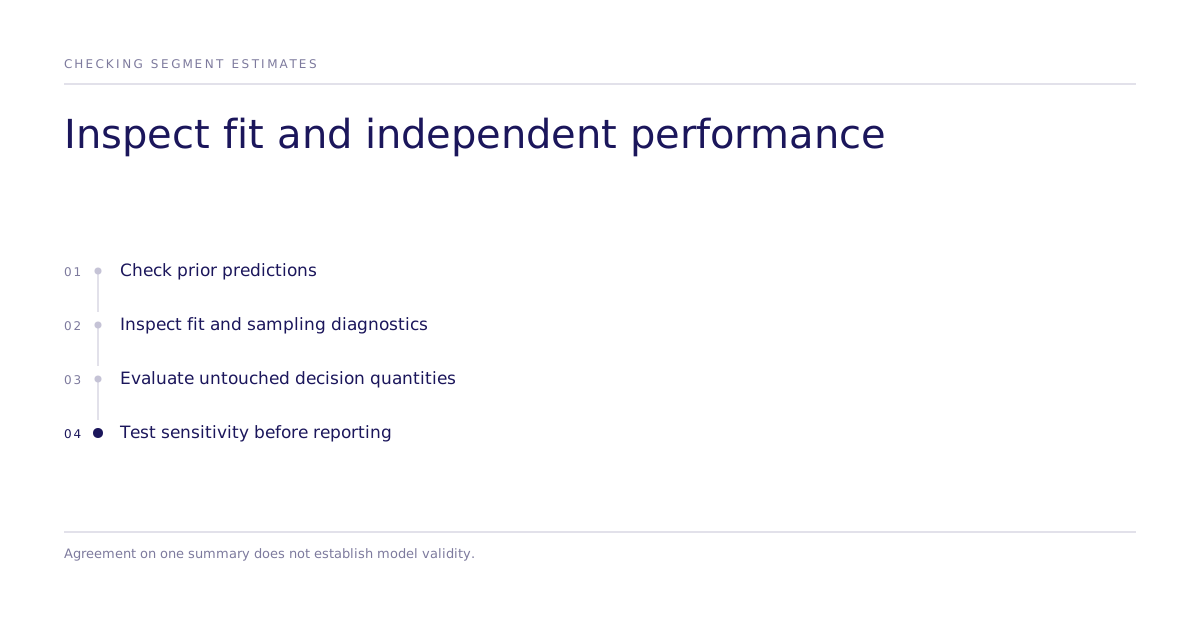
A prior predictive check simulates outcomes before conditioning on the
observations. Compare outcomes and relevant group contrasts with defensible
domain ranges. Excessively wide or narrow outputs can reveal unsuitable
assumptions. A plausible marginal range alone does not prove all priors
are useful; inspect prior sensitivity for the decision's target quantity.
7. Does the fitted model actually match the data it was trained on?
A posterior predictive check compares fitted-model simulations with
observations. In the equity example, the displayed check examines the
marginal return distribution in an estimation window. Agreement on that
summary cannot rule out misspecification of sectors, tails, temporal
dependence, or forecasts. Add checks for those quantities and evaluate
untouched future periods without tuning on their results.
8. What would change the pooling choice?
Compare full pooling, no pooling, and partial pooling on the quantities
and loss that matter to the decision. Test sensitivity to group definitions
and exchangeability assumptions. A hierarchy can adapt toward shared effects
but adds estimation choices. Keep a simpler model when it performs adequately.
For financial backtests, check data availability, leakage, turnover, and costs;
historical performance does not establish a profitable deployment.
Where this reasoning applies beyond return models
For a buyer-choice study, ask how subgroup coverage, pooling, and uncertainty
are handled. Generated choices, human stated choices, and actual purchases
have different endpoints. Randomized study effects are conditional on
their identification assumptions; a hierarchy is an estimator choice,
not a replacement for an identified design.
The equity example belongs to PyMC Labs. It does not establish a particular
Subconscious forecasting or financial-modeling deliverable. Confirm
any proposed service directly. For a choice experiment, specify
the audience, comparator, assignment, endpoint, and analysis in a
study discussion, then compare results with the independent
human or behavioral evidence that the decision requires.
The public evidence summary reports aggregate
choice-parameter rank replication, not this financial backtest.
Limitations
The source's balanced training panel favors continuously traded firms.
Its estimates and historical backtest depend on its sample, period,
preprocessing, model, and cost assumptions. Those results do not establish
performance for newly listed firms, other markets, or a future regime.
Preserve these limits when presenting segment estimates.