Aaru and EY: What a 90% Correlation Claim Actually Covers
A synthetic-research vendor publishes a correlation number against a Big Four partner, and the number circulates as proof the category works. Before that number changes where a research budget goes, a buyer needs to know what question type it actually covers.
The claim: a partnership-published correlation
Aaru, a multi-agent behavior simulation vendor, and EY published a correlation of approximately 90 percent between Aaru's synthetic simulation outputs and EY's real-respondent results on parallel research questions (EY, "How AI simulation accelerates growth in wealth and asset management"). EY ran studies holding both a human-respondent baseline and an Aaru synthetic result, then measured how closely the two tracked.
A correlation number is only useful to a buyer when its boundaries are stated alongside it. That is a partnership-published figure, not an independently verified or peer-reviewed result. Neither Subconscious nor any other vendor has replicated it.
What does "90 percent correlation" measure?
Correlation measures co-movement: when the human result moves up, the simulated result tends to move up too. It does not by itself establish that the two match in scale or level; a synthetic series scaled or shifted relative to the human series can still produce the same correlation. A 90 percent correlation means the two cluster tightly along that pattern across the tested questions.
The individual misses sit next to the aggregate hit rate for anyone checking the number. It does not mean the simulation matched any single human result exactly. Individual questions can still miss by a meaningful margin even while the overall correlation stays high, a portfolio-level statement about direction, not a per-question accuracy guarantee.
What does the correlation not establish?
- It does not establish causation. Reproducing an observed pattern is not the same as identifying which action produced it.
- It does not transfer to a different question type. A correlation measured on the stated-preference and concept-reaction questions here is evidence about that question type, not a general accuracy rating for every use of synthetic research.
- It does not replace a validation path for a higher-stakes decision. A single partnership case study is not the same as a vendor's own defined and sourced validation corpus that a buyer can inspect study by study.
Where this fits against a broader validation picture
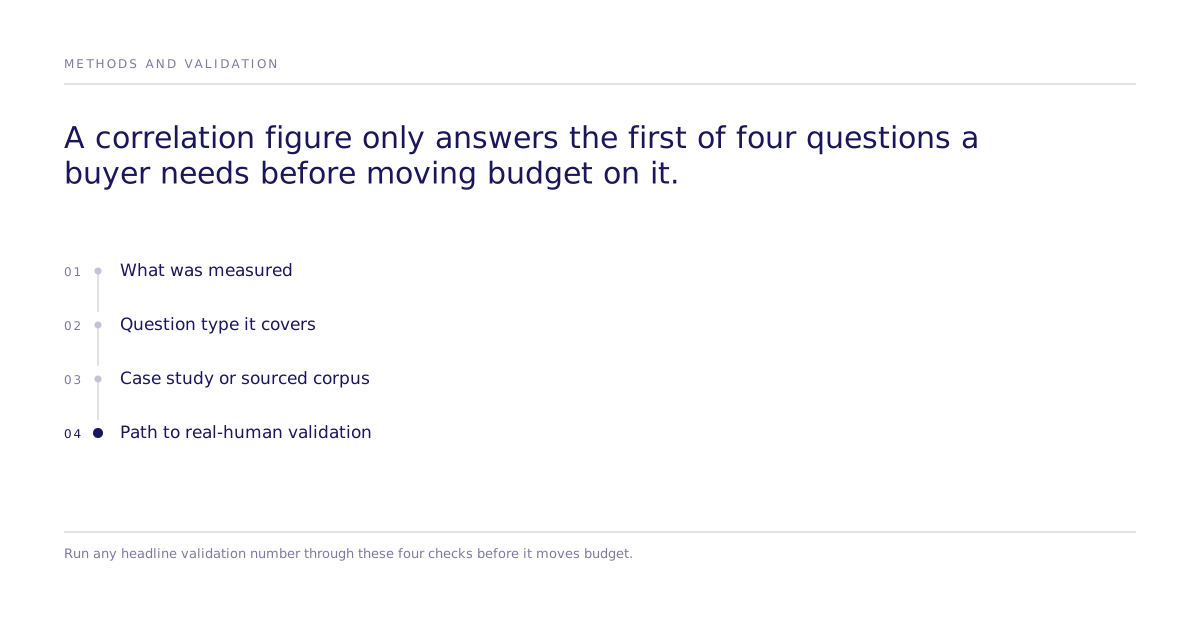
Any synthetic-research or causal-simulation buyer should ask three questions before treating a headline number as sufficient: what was measured, what question type it covers, and whether there is a path from simulation to real-human validation without changing the underlying question.
Subconscious approaches that third question directly. Its causal behavioral experiments move from a simulated population to real-human participants when a decision needs that added confidence. Its validation corpus is defined and sourced rather than resting on one partnership: on the causal fidelity paper, its best configuration reaches 87% of the measured human ceiling on one study, 0.832 rank correlation against a 0.959 human-to-human ceiling, with a mean of 0.73 across the 43 studies passing design filters, drawn from roughly 300 replicated studies across 9 domains. Naming exactly what a figure covers is what lets a buyer check it against their own decision. That figure describes replication of past study outcomes, not prediction accuracy on a novel decision, and is not interchangeable with the Aaru-EY correlation figure above, which measures a different comparison.
Controlled studies can also draw on an 800M-person audience graph as a sampling pool, distinct from a recruitable human panel; graph size is not a measure of statistical precision, which depends on respondent count, choice tasks, and design efficiency, and it matters mainly for the breadth of population available to sample rather than everyday message or concept testing.
A short checklist before trusting a validation claim
| Question to ask | Why it matters |
|---|---|
| What was actually measured? | Correlation, prediction accuracy, and replication accuracy answer different questions and aren't interchangeable. |
| What question type does it cover? | A number from stated-preference or concept-reaction testing may not transfer to a launch, pricing, or market-entry decision. |
| Is the source a partnership case study or a defined validation corpus? | A single case study can't be interrogated study by study the way a published corpus can. |
| Is there a path to real-human validation? | A higher-stakes decision benefits from testing the same causal question with real participants before it ships. |
| Does the claim state its own limits? | A claim without stated boundaries is a marketing number, not evidence. |
What's the practical takeaway here?
A correlation number like Aaru and EY's is a reasonable signal that behavior simulation can reproduce useful aggregate patterns on the question type tested. It is the start of a buyer's evaluation, not the end. Before moving budget toward any vendor's headline accuracy claim, run it through the checklist above. Subconscious's research documents that path; its case studies show it applied to buyer decisions.
Teams comparing methods at this stage often also want to see how a causal experiment is structured and run before deciding which validation path fits their decision.