Understanding the margin of error in simulations
A VP of consumer insights evaluating a synthetic pricing panel needs to separate uncertainty in the estimate from error in representing real buyers. A margin of error may come from probability sampling or a supported model; randomized treatment assignment alone does not establish population representativeness. More simulated respondents can reduce conditional Monte Carlo error while leaving a biased response model unchanged.
- A margin of error depends on the estimator, sampling or assignment design, dependence between observations, and population covered.
- EY and Aaru's reported 0.90 median Spearman correlation describes a particular recreation of a wealth survey. It is evidence about that configuration, rather than an error bound for the next pricing study.
- Resemblance scores can hide bias instead of revealing it: the same EY/Aaru study posted a -0.38 rank correlation on inheritance planning even while the median across 53 questions hit 0.90.
- The cited digital-persona study reports higher individual-level divergence than aggregate-level divergence; those results do not establish a universal ratio.
- Multinomial logit, mixed logit and ICLV are model families. Their intervals require appropriate estimation, dependence handling and assumptions; a simulated interval alone does not establish real-market coverage.
What does margin of error actually mean in a simulation?
An interval quantifies uncertainty in a specified estimate under stated assumptions. For a probability-sample survey, the sampling design determines the variance calculation. For a randomized choice experiment, assignment supports causal identification within the studied population, while respondent clustering and the fitted model affect estimation uncertainty. For synthetic responses, distinguish variability between draws from uncertainty about the response model and its transport to humans. Adding draws can narrow the first while leaving the latter unresolved.
Why a 0.90 correlation to last year's survey is not a margin of error
EY recreated its 3,600-respondent Global Wealth Research Report with Aaru and reported a median Spearman correlation of 0.90 across 53 questions and average RMSE of 7.1 percentage points (EY report). The comparison asks how closely the evaluated synthetic responses matched that human sample. A changed model, prompt or simulated sample can change the benchmark score and its estimation error even if the human dataset stays fixed. The comparison does not supply an interval for a new market, outcome or intervention.
A topic-level disagreement hidden by the median
The same EY report gives a -0.38 rank correlation for inheritance planning and discusses separate behavioral evidence as a possible interpretation of the disagreement. The correlation alone does not establish whether the simulation, the self-reports or an unmatched behavioral comparator better describes the target decision. A matched behavioral check is needed. Separately, a 29-test study involving 2,073 participants reports systematic discrepancies between human and LLM design preferences, including position and order effects (Kuric and colleagues). Increasing simulated sample size cannot by itself remove a systematic response artifact.
"Our results unveil significant and systematic discrepancies between peoples' real design preferences and LLM simulations that are consistent across manipulations."
Kuric, Demcak, and Krajcovic, "Distorted Perspectives of LLM-Simulated Preferences," arXiv:2605.18311 (source)
Individual-level prediction carries higher error than population-level prediction
A digital-persona benchmark reports aggregate Jensen-Shannon divergence of 0.011 to 0.046 and individual-level divergence of 0.056 to 0.090 (Mumin and Jia). The endpoints summarize ranges, rather than matched study-level ratios. These results support checking the level of prediction your decision needs; they do not prove that every segment or individual task has the same error profile.
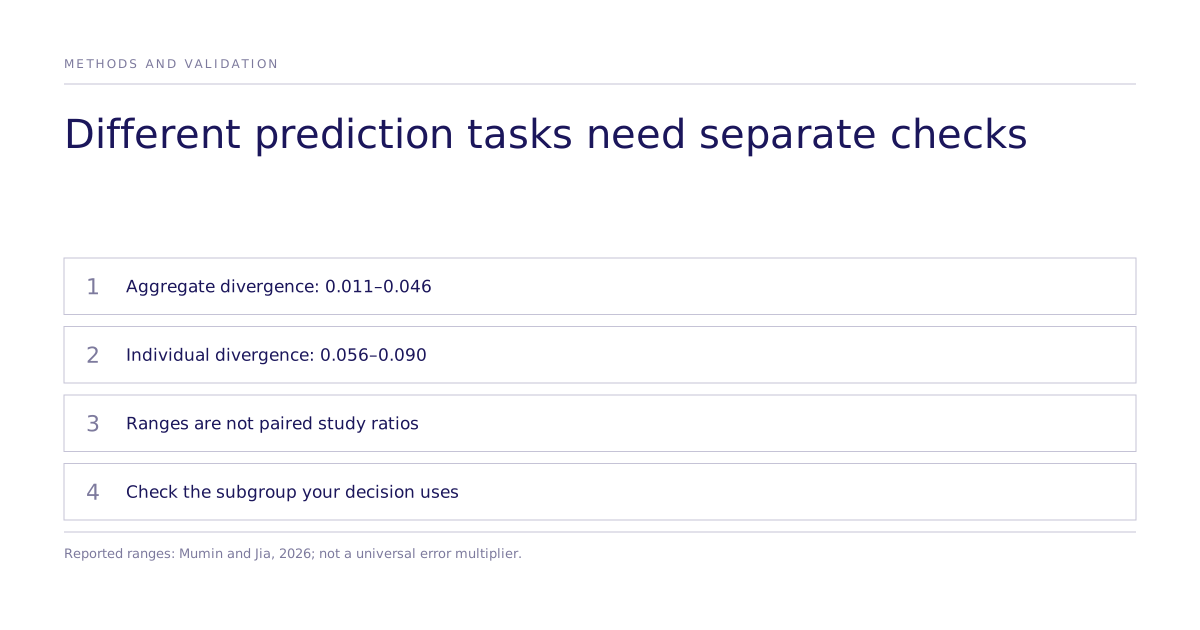
A market average, a segment estimate and an individual prediction require separate validation. A strong aggregate score can coexist with weak performance on a decision-critical subgroup.
What supports an interval in a choice experiment?
Randomized attributes can identify effects on choice within the tested population, subject to the design's support and restrictions. Multinomial logit, mixed logit and ICLV specify how choices are modeled; they are not interchangeable with randomization. Multinomial logit imposes proportional substitution through its independence of irrelevant alternatives assumption. Mixed logit can relax that assumption. Confidence or credible intervals also depend on estimation assumptions, repeated tasks per respondent, and model fit. Coverage for real buyers requires evidence beyond conditional synthetic-response variability.
Where do Subconscious's own validation numbers fit?
Subconscious's public causal-fidelity working paper reports agreement on estimated choice parameters across published studies. That evidence can help screen a configuration, but does not provide the sampling variance or human-population error bound for a new pricing study. Ask how held-out human comparisons, design checks and transport limits apply to your question; see the validation methodology.
Resemblance score or margin of error: which one should a buyer trust for a decision?
Use benchmark evidence to assess previous performance, an interval to describe uncertainty under its stated model or design, and a matched external check to assess bias and transport. None alone bounds every source of decision error.
| Question | Benchmark agreement | Interval for the current estimate |
|---|---|---|
| What it measures | Agreement on an evaluated dataset and configuration | Estimation uncertainty under stated assumptions |
| Derived from | A specified human comparator and scoring rule | Sampling, assignment or model-based variance calculation |
| Behavior with sample size | Score and uncertainty can change with configuration and simulated sample size | May narrow with effective sample size; clustering and systematic error matter |
| What it can hide | Weak topic or subgroup performance behind an aggregate | Response-model bias and poor transport beyond the interval's scope |
| Best for | Assessing a specified prior comparison | Assessing uncertainty in a specified current estimate |
For more on how validation studies are built and where their limits sit, see the methods and validation hub.
Before approving the study, ask for the benchmark dataset, configuration and denominator; then ask what the current interval includes, what it omits and which population it covers. Decide which human or behavioral check is needed before the pricing decision. Meet with the team to examine that design.