What to Demand Before You Trust a Synthetic-Respondent Vendor's Accuracy Claim
A vendor's self-reported accuracy number is a marketing claim until you can reproduce it. The question is not what number the vendor publishes, but what evidence backs it and whether you can replicate it against your own historical data. It has to survive test-retest checks, item-level scrutiny, and an independent replication before a decision leans on it.
Why the aggregate number alone is not proof
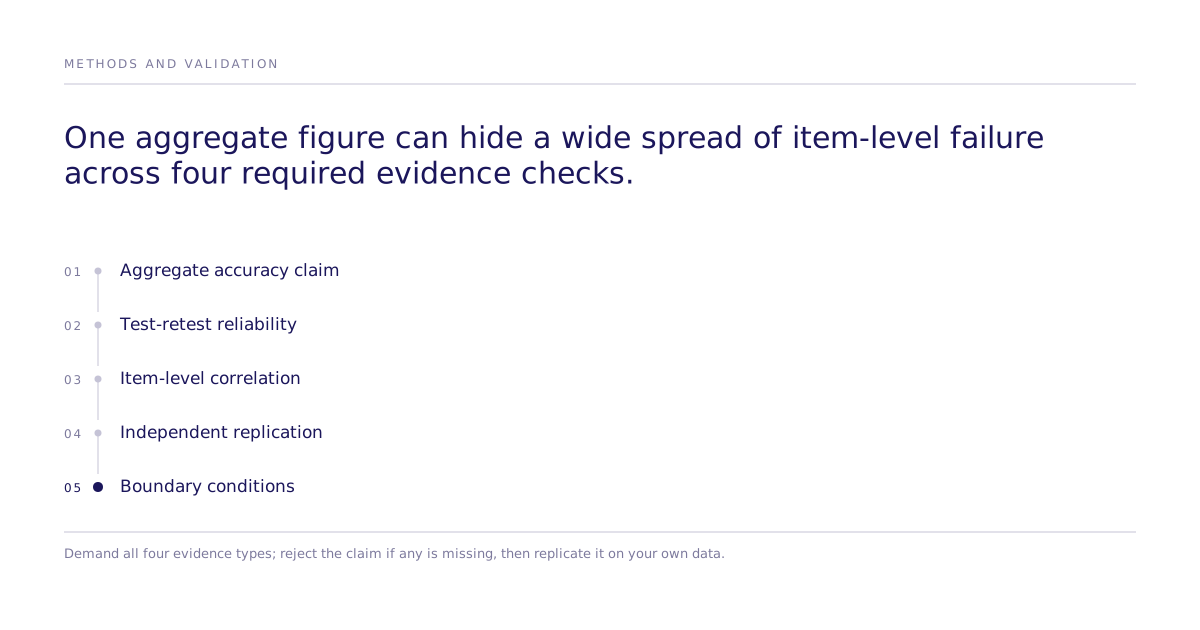
A single correlation figure between synthetic and real respondent distributions can hide a wide spread. A platform that reports one clean number might be averaging a long tail of low-agreement items against a smaller set of near-perfect ones, a different pattern than a methodology that holds steady across every item. Treat any headline accuracy figure as a starting point for questions, not the answer.
What to ask a vendor before you believe the number
| Evidence type | What it shows | Red flag if the vendor can't produce it |
|---|---|---|
| Test-retest reliability | Whether re-run dispersion matches human re-fielding dispersion, and results hold across prompt paraphrase and model version | Only reports one-time accuracy, or near-perfect stability with no comparison to human re-fielding variance |
| Item-level correlation | Whether accuracy holds question by question, not just averaged across a study | Reports only a single aggregate figure |
| Independent replication | Whether the method reproduces a study the vendor didn't design or select | Cites only its own internal validation studies |
| Boundary conditions | Which question types, audiences, and decision contexts the accuracy claim does not cover | Presents the accuracy figure as universal, with no stated limits |
A vendor that reports aggregate accuracy without test-retest reliability data is reporting half the story, but test-retest agreement alone can mislead: for LLM-based synthetic respondents, near-perfect stability is nearly free at low sampling temperature and can signal degenerate, insufficiently heterogeneous output. The defensible test is whether re-run dispersion matches human re-fielding dispersion, and whether results hold across prompt paraphrase and model version.
What the published research actually supports
The academic literature on LLM-conditioned synthetic respondents is worth reading directly, not secondhand from a vendor's own summary of it. Argyle, Busby, Fulton, Gubler, Rytting, and Wingate pulled respondent demographics from the American National Election Studies, built those into backstories for a language model, and found the resulting response distributions correlated strongly with survey distributions across political-attitude batteries, including within demographic subgroups (Argyle et al., 2023, Political Analysis).
A related NBER working paper by Horton tested whether a language model conditioned on agent profiles would reproduce classic behavioral-economics results: Charness-Rabin social-preference allocations, the Kahneman-Knetsch-Thaler snow-shovel fairness scenario, Samuelson-Zeckhauser status quo bias, and a minimum-wage hiring experiment. The synthetic agents reproduced the qualitative findings, though Horton cautions against relying on the magnitudes.
A 2024 Political Analysis paper by Bisbee, Clinton, Dorff, Kenkel, and Larson, on whether LLM output can stand in for human survey responses, generated synthetic ANES feeling-thermometer responses and found that synthetic response variance was drastically understated, producing artificially precise standard errors and spurious significance, that subgroup contrasts were distorted, and that results shifted with prompt wording and model version.
That variance-understatement finding matters more than any headline correlation number, and none of the three studies above tested stated-preference or discrete-choice methods: the research consensus is not "synthetic respondents are accurate," it's "synthetic respondents show directional agreement on vote choice, economic games, and feeling thermometers, with precision claims requiring independent scrutiny."
Where the accuracy gap is largest
Across the published studies, the pattern is consistent:
- Novel-behavior prediction. Questions about new product categories or behaviors outside what a language model has meaningful signal about show the widest gaps, though published comparisons rarely quantify the size of the gap.
- Niche audiences with thin public signal. Accuracy depends on the model having seen enough data about a population, and small, specialized B2B roles or industries are where that signal thins out.
- Regulatory and compliance-substantiation studies. Synthetic data is not a substitute for real-human-respondent data on the record, regardless of how strong the correlation is elsewhere.
- High-stakes, real-consequence decisions. A synthetic respondent and a human survey respondent are both answering a hypothetical question; the gap between a hypothetical answer and real consequences applies to both, so a synthetic-vs-human survey comparison cannot validate against it.
How to run the validation yourself
A procurement team does not have to take any vendor's word for its accuracy number. The workflow is the same regardless of platform:
- Find a past study in your own archive with a known outcome distribution.
- Recreate the demographic, role, and segment specifications that defined the original sample.
- Run the equivalent question battery using the same stimuli and framing as the original study.
- Compare the new distribution to the original, both in aggregate and item by item.
- Decide from your own numbers, not the vendor's marketing page, whether the method is accurate enough for the decision.
This carries more weight than a vendor's marketing figure, but only if you also account for the human benchmark's own re-fielding variability, recognize that an archived study certifies only the conventional regime it came from, and rule out the study having been public enough for the model to have trained on it: your data, your replication, your result.
Where a causal-experiment approach fits
Subconscious's position is that validation belongs inside the experiment design, not bolted on afterward as a marketing statistic. A randomized experiment is built against a simulated population with a human baseline and holdout built in, rather than validated once and reused as a blanket claim across every future study. Subconscious can test or validate studies with real human participants, so a team can move from a simulated run to real-human validation on the same causal question, without redesigning the study.
Limitations
Simulation is not a substitute for real-human validation on high-stakes, regulatory, or commitment-context decisions. No vendor's accuracy figure should be accepted as proof for a specific question type or audience without independent replication against your own data. Current replication results are published on the leaderboard.
Next step
Before signing with any synthetic-respondent vendor, ask for test-retest reliability data, item-level correlation, and one study you can independently replicate against your own historical results. If a vendor can't produce all three, start a conversation about which of your decisions are ready for a controlled comparison instead.