AI Customer Satisfaction Research Beyond NPS
For an illustrative readout, NPS moves two points while CSAT holds at 4.1. The team still needs to investigate what changed and which intervention could help. The example scores are not measured findings.
AI-assisted exploration can suggest satisfaction hypotheses by segment. Compare those suggestions with customer evidence before using them to choose a fix.
Why the score is shallow
NPS records a recommendation response, and CSAT records satisfaction with a defined experience. Measure how many eligible customers answer the survey and its open field, and evaluate the usefulness and coding quality of those answers.
Nonresponse may bias a satisfaction study, but a low response rate does not establish which customers are overrepresented. The linked 2017 Pew analysis concerns US telephone polls, not post-interaction CSAT. It finds that response rate alone is an unreliable indicator of bias. Assess missingness against your eligible customer cohort.
Timing also changes the response: emotion is fresh right after an interaction and detail is lost weeks later.
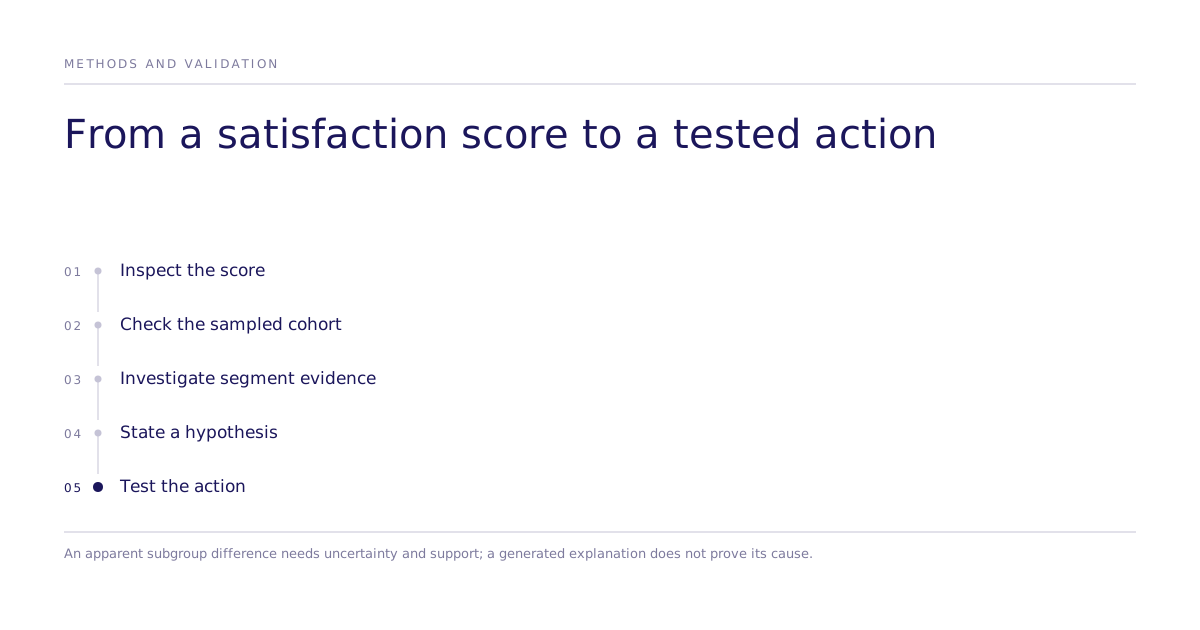
Hypothetically, an overall CSAT of 4.2 might combine enterprise responses averaging 4.6 with SMB responses averaging 3.4. Those values are illustrative. Inspect subgroup sample sizes, uncertainty, and comparability before interpreting deeper splits; a simulated sample cannot repair missing human evidence by increasing the generated count.
What can replace the rating prompt?
Instead of asking for a rating from 1-5, define the customer segment and walk through the relevant experience. Ask what worked, what failed, and what the customer would do next.
Build separate definitions for enterprise accounts, SMB users, customers in their first 30 days, and experienced users. Run the same protocol across all of them so differences are visible.
An AI-assisted exploration can help prioritize questions for a human study. Estimate its design, review, and validation effort from the actual scope. A generated diagnosis does not establish that a product change caused a score to move.
Questions scores cannot answer
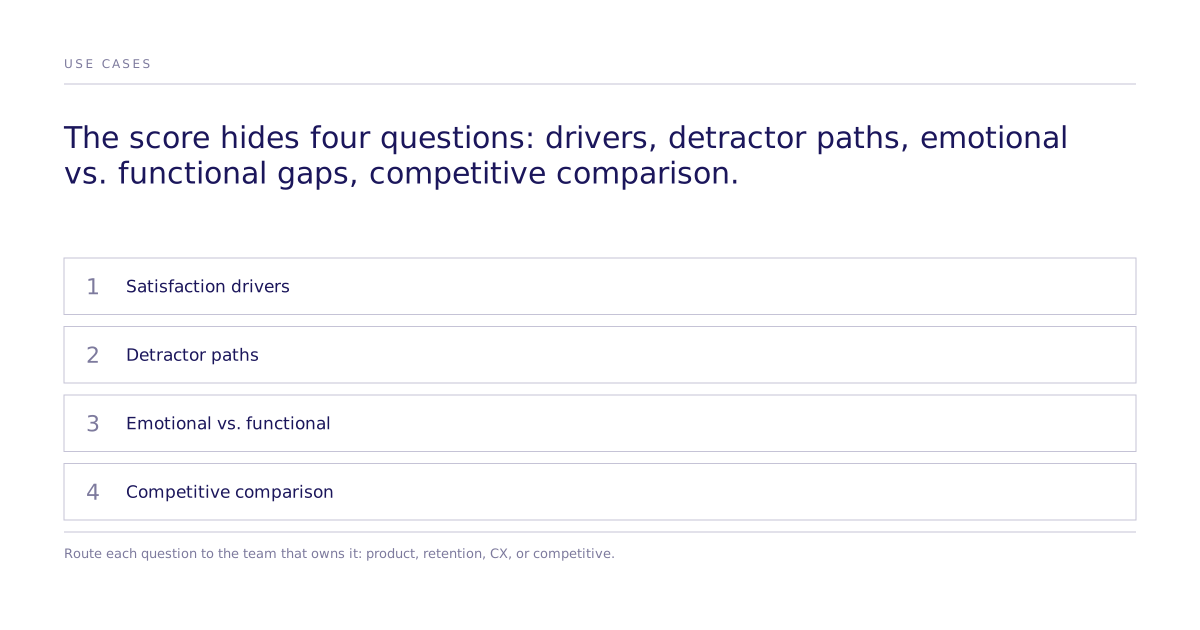
What are the satisfaction drivers?
Identify which parts of the experience matter for each segment: speed, reliability, onboarding, support, or pricing relative to value.
Detractor paths
Ask what would need to change, and in what order, for a dissatisfied customer to reconsider. Translate the answer into a product or service action that can be tested.
Emotional and functional experience
A product can work while the customer feels ignored or constrained. A customer can like a brand while struggling with the product. Do not collapse those conditions into one number.
How does competitive comparison work?
Use public evidence to model how an alternative's customers may define satisfaction. Treat the result as positioning research, not a statement from real competitor customers.
Use the diagnosis across teams
Product teams can test whether a proposed roadmap item addresses an important satisfaction driver before spending a quarter on it.
Customer-experience teams can map the full path from discovery through onboarding, daily use, and renewal rather than relying only on post-interaction surveys.
Retention teams can study at-risk segments before dissatisfaction appears as cancellation. Churn is a lagging indicator, and the relevant intervention may occur months earlier.
Competitive teams can compare possible loyalty drivers and investigate where an alternative appears vulnerable.
A three-step setup
First, define customer groups relevant to the decision, such as plan, tenure, use case, and geography. Ground definitions in customer evidence and check support for subgroup comparisons.
Second, design a consistent protocol. Begin with the overall experience, then probe onboarding, support, pricing relative to value, trust, recommendation, and switching.
Third, compare evidence by segment with uncertainty and nonresponse limits. Use apparent differences to prioritize investigation, then test the proposed action on the outcome that matters.
The aggregate score is an observed attitude measure. A generated explanation is a hypothesis. A designed experiment can estimate an action effect for its endpoint; a mechanism or actual retention claim needs evidence that supports that further inference.