Bechtel Carbon Tax Policy Study: Simulated vs. Published Results
Policy and public-affairs teams weighing a costly, slow fielded study on a carbon tax package need to know whether a simulated discrete-choice experiment gets close enough to trust for an early pass.
The comparison
Bechtel, Scheve, and van Lieshout fielded a discrete choice experiment across four countries, the U.S., U.K., Germany, and France, asking what international climate agreement design features people there favor, among them participation breadth, cost distribution, and enforcement (Improving public support for climate action through multilateralism, Nature Communications, 2022).
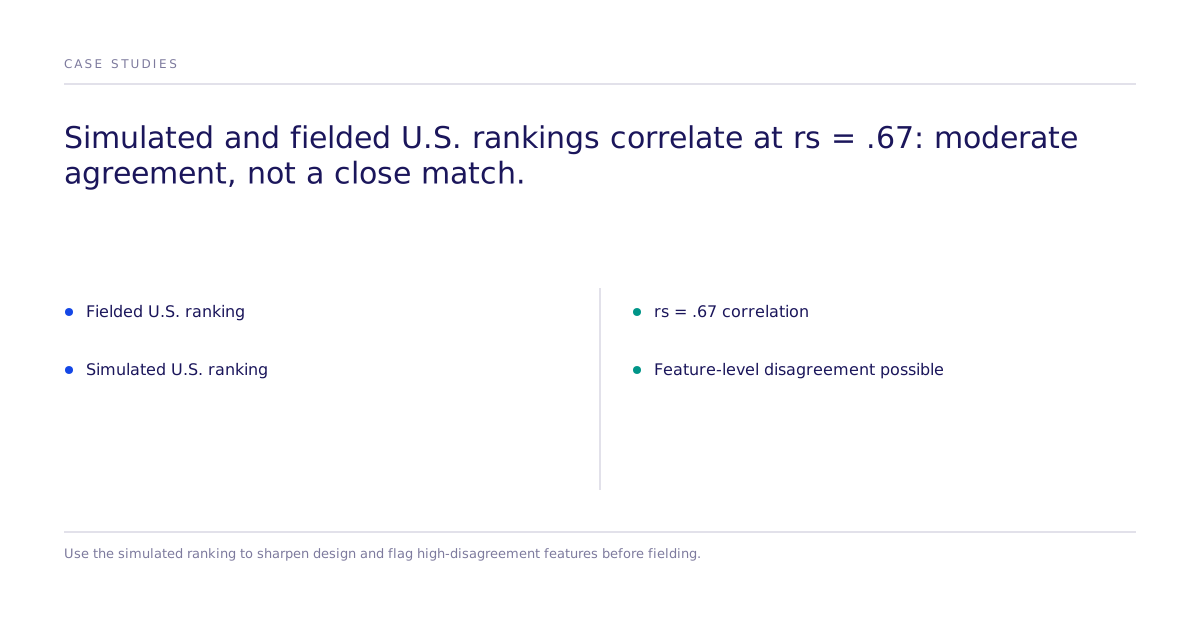
Subconscious ran the same discrete-choice design on a simulated U.S. population and compared the resulting preference ranking against the paper's pooled U.S. results. The two rankings correlate at rs = .6711.
What does a correlation of .67 mean for this decision?
A number without its limits reads like marketing. A Spearman correlation of .67 is a moderate, positive relationship: the simulated and fielded studies tend to agree on which carbon tax features respondents prefer more or less, but not closely enough to treat the simulated ranking as a stand-in for the fielded one on every feature. Treat it as one data point on whether the method is directionally reliable for this kind of policy-preference question, not proof that a simulated ranking will match a real vote or survey.
What are the limitations of this comparison?
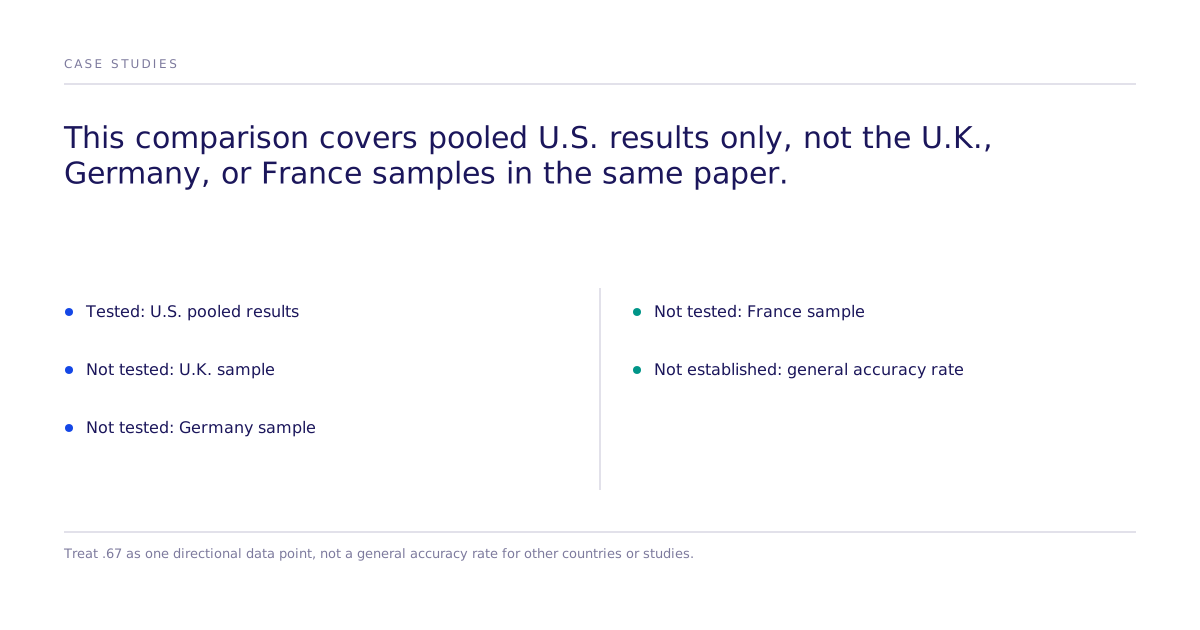
The misses appear on this page next to the hits. This comparison covers one replication, on one country's pooled results, against one published study. It does not extend to the U.K., Germany, or France samples in the original paper, and one correlation coefficient does not establish a fixed accuracy rate for policy-preference studies generally. A moderate correlation also means feature-level orderings can still diverge even where the overall ranking pattern agrees.
What's the next step?
For a policy or public-affairs question where getting the tradeoff wrong is expensive, use a simulated run like this one to sharpen the design and flag which features carry the most disagreement risk before committing to a fielded study. See how the underlying method works on /how-we-work, or review more replication comparisons on /case-studies.