Bayesian Spatial Modeling for Evaluating Hockey Goaltending Performance
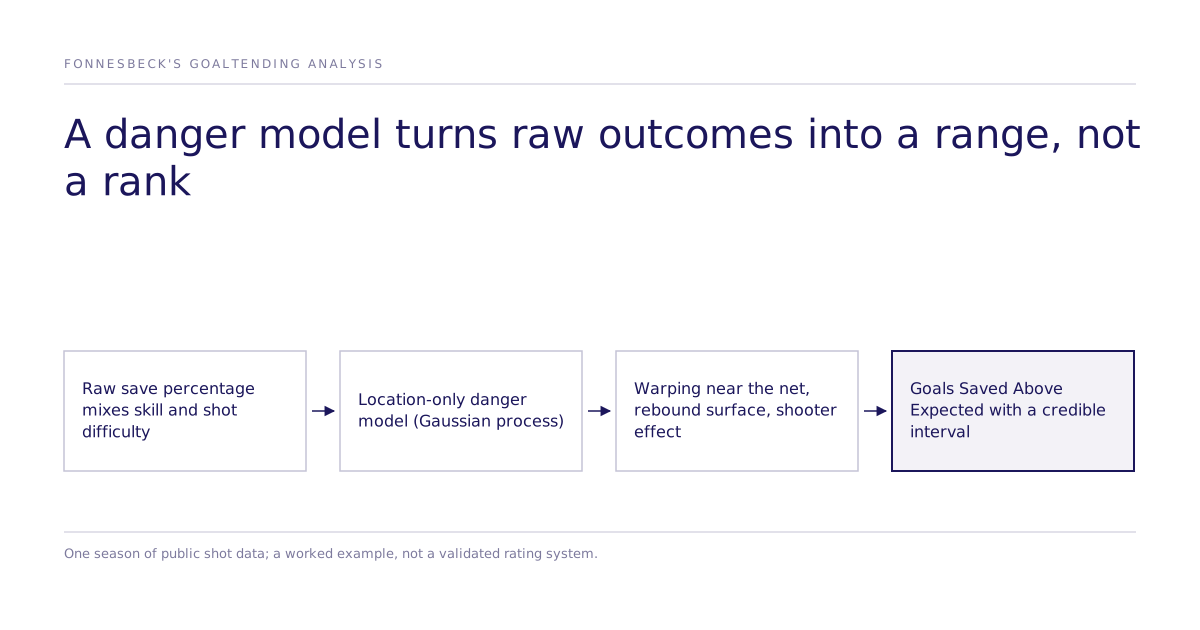
A goalie's save percentage answers a narrow question: what share of shots did they stop? It does not answer the question a general manager needs answered: did this goalie perform well given the shots they faced? A goalie behind a strong defense sees fewer dangerous chances and looks better than their true skill. A goalie facing a barrage of high-danger rebounds looks worse. The raw number conflates skill with the difficulty of the job, and it reports that conflation as a single confident figure with no sense of how much of it is noise.
The same problem shows up anywhere a team judges performance from a raw outcome rate: a sales rep's close rate without adjusting for lead quality, a campaign's conversion rate without adjusting for audience, a support agent's resolution time without adjusting for ticket complexity. Trusting the raw number rewards position over skill.
How do you separate shot difficulty from goalie skill?
Christopher Fonnesbeck, a Data Science Fellow at PyMC Labs, worked through this problem for a full NHL season in "Bayesian Spatial Modeling for Evaluating Hockey Goaltending Performance" (December 4, 2025). He built a spatial model of shot danger, then measured each goalie against that model instead of against a league-wide average. The numbers in this section and the next come from that post, which includes its code snippets inline and does not link a separate repository. The dataset covered shots from the 2023-2024 season, sourced from MoneyPuck: 121,670 raw shots across 99 goalies and 921 shooters, reduced after filtering out empty-net, power-play, and non-offensive-zone shots to 91,247 shots, a 75.0% retention rate.
The core idea: model the probability of a goal as a function of where the shot came from, using a Gaussian process. A Gaussian process learns a smooth surface over the ice rather than a single number: it estimates goal probability at every point in the offensive zone, plus how uncertain that estimate is, based on nearby observed shots. Points close together on the ice are assumed similarly dangerous; the model lets the data determine how fast that similarity decays with distance.
Fitting an exact Gaussian process to tens of thousands of shots is computationally expensive, so the analysis used a Hilbert Space Gaussian Process approximation, which projects the surface onto a finite set of basis functions to make the computation tractable at that scale.
What does the baseline model get wrong?
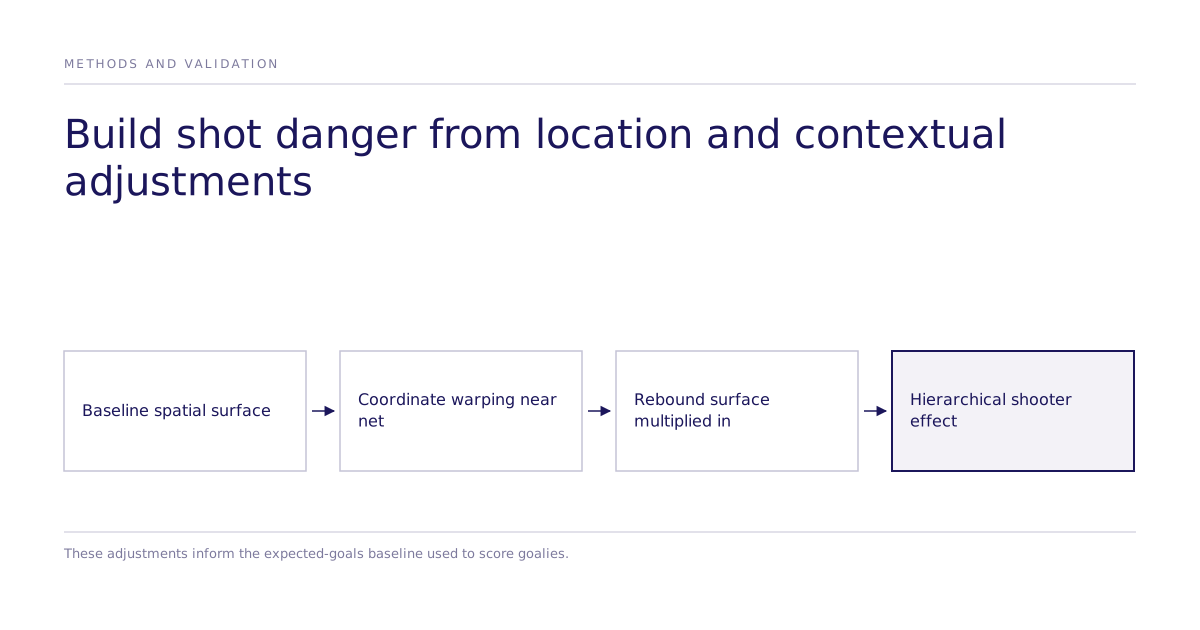
The baseline uses a stationary covariance kernel: spatial dependence is governed by separation rather than absolute location. That does not force a constant goal probability or gradient across the ice. That is not true near the net, where danger rises sharply over a short distance, compared to farther out, where it changes far more gradually. The analysis corrected for this with coordinate warping: transforming the input coordinates with an arcsinh (inverse hyperbolic sine) function of distance from the goal, using a 5-foot offset and a 20-foot scale parameter, so the model could vary its effective sensitivity to location faster near the net and more slowly farther out.
From there, the model added a rebound indicator, since a shot immediately following a rebound is a different kind of scoring chance than an unassisted shot from the same spot. Rather than adding a constant rebound bonus everywhere on the ice, the analysis modeled the rebound effect as its own spatial surface and combined it multiplicatively with the baseline latent log-odds surface. The rebound interaction is location-dependent; it is not a uniform boost to goal probability.
Finally, the model added a hierarchical shooter effect: a per-shooter adjustment, estimated jointly across all shooters so that shooters with few recorded shots borrow statistical strength from the overall distribution rather than producing a noisy individual estimate. That hierarchical structure (modeling many related units together instead of one at a time) is the same discipline behind treating any small-sample group (a new sales territory, a newly launched product SKU) as informed by, but not identical to, the population it belongs to.
What is Goals Saved Above Expected?
Once the model estimates expected goal probability for every shot a goalie faced, it can compute Goals Saved Above Expected: the sum of expected goals across all shots faced, minus goals allowed. A positive value means the goalie prevented more goals than the model expected given shot quality; a negative value means they allowed more. Fonnesbeck’s worked example uses this expected-goals comparison.
The distinguishing feature of the Bayesian version of this metric is not the point estimate. It is the interval around it. Because the underlying goal-probability model produces a full posterior distribution rather than a single number, the resulting Goals Saved Above Expected figure comes with a credible interval attached to every goalie's estimate, not just a ranked list. Read the interval alongside its model assumptions before interpreting a ranking.
In Fonnesbeck's analysis, some goalies with a negative point estimate had credible intervals that included zero. For those goalies the data cannot separate true underperformance from noise. That is not a modeling failure. The interval expresses uncertainty conditional on the fitted model, not proof that all sources of error have been accounted for.
Why the uncertainty is the deliverable, not the ranking
It is tempting to read a model like this as a ranked list of goalies, the least useful thing to take from it. Fonnesbeck's post is one worked example on one season of public shot data: a demonstration of a modeling approach with a Bernoulli goal likelihood and logit-linked spatial predictor, not a validated production rating system. Its goaltender estimates belong to that one analysis, not to any standardized industry benchmark.
What generalizes is the discipline: before trusting a raw outcome metric, ask what confounds it, model those confounds explicitly, and report the estimate as a range rather than a single number. That discipline is the same one Subconscious applies to causal action testing: a tested pricing change, message, or product variant is reported with a quantified effect and an uncertainty band, not a single confident number standing in for "this worked." A range that overlaps with "no effect" is treated as inconclusive rather than rounded up to a win.
Where this method stops
This kind of model estimates relative performance against expectation within one dataset and one modeling choice; it does not certify universal truth about a player's skill. The underlying danger surface's uncertainty is widest in ice regions with fewer, noisier shots; on the summed Goals Saved Above Expected metric, interval width instead grows with the number of shots a goalie faced, wider for high-volume starters than for rarely-used backups. Absolute uncertainty in a season total differs from uncertainty in a per-shot rate; a wider total interval need not imply less precise rate estimation. A production deployment would need cross-season validation, additional contextual variables such as team defensive quality, a goalie term so that each goalie's own shots do not inform the expected-goals baseline used to grade them, and sensitivity checks against alternative model specifications, none of which are attempted here.
The broader takeaway for any team deciding whether to act on a performance number: ask whether that number has been adjusted for the difficulty of the situation it was measured in, and ask whether it comes with a range or a single point. If the answer to either is no, treat the number as a starting hypothesis, not a decision. For simulated choice studies, intervals describe modeled stated choice under the configured analysis; human or live transfer needs matched evidence. See the study approach; and the research page lists the published evidence with its limits.