Can an LLM Stand In for a Human Survey Respondent? What One Benchmark Found
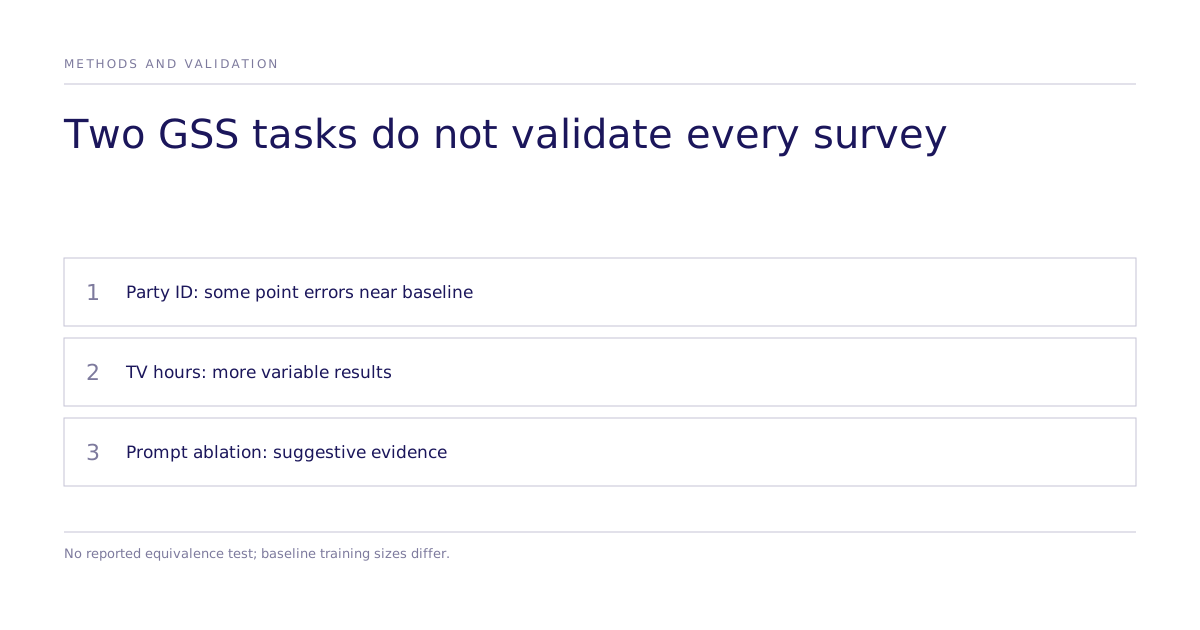
In one GSS benchmark, several demographic-conditioned LLMs approached the random forest’s point error on political party identification. No equivalence test established that their performance was the same. TV-viewing predictions varied more. Before a buyer relies on a persona response, the buyer needs matched evidence for the specific question.
What was actually tested
Allen Downey’s June 3, 2025 PyMC Labs benchmark prompted LLMs using real respondents’ demographic traits. It used the General Social Survey (GSS) and evaluated two questions:
- Party identification, self-reported on a seven-point spectrum running from Strong Democrat at one end to Strong Republican at the other.
- Hours of daily TV viewing, sorted into five buckets ranging from one hour or fewer up to six or more.
Each model's error was scored as the mean absolute distance between its answer and the real respondent's, averaged over a random sample of 100 held-out respondents, and compared against the baselines below. That comparison is intentionally asymmetric: the random forest is supervised on in-domain data, while the language models rely only on pretraining, so it contextualizes the LLM output rather than claiming the two methods are equivalent. GSS microdata and its published cross-tabs are public, so the language models' pretraining may itself include the demographic-attitude relationships being tested, a possible source of overlap the study does not rule out.
| Method | How it works | Training data |
|---|---|---|
| Naive baseline | Always predicts the median response | None |
| Random forest | Supervised model trained on real respondents | 3,000 respondents (party ID); 2,000 (TV hours) |
| LLM persona | Model prompted with demographic traits, no task-specific training | None (pretraining only) |
Where did the model do well?
On political party identification, most large models tested, including GPT-4o, Claude 3.7 Sonnet, and Gemini 2.0 Flash, landed within the range between the naive baseline and the random forest, several approaching its accuracy, though the study reports no standard errors, so these differences cannot be called equivalence. Claude 3 Opus came close to the random forest despite no task-specific training.
A control run removed all demographic information from the prompt and asked the same question generically. Performance collapsed below the naive baseline across every model tested. That comparison is suggestive but not conclusive: under mean absolute error a naive median predictor is hard to beat, so falling below it in the no-demographics arm is close to expected regardless of whether the model uses demographic signal, and the ablation changed the prompt's content and framing along with the demographic fields.
Where did the model break down?
Daily TV-viewing hours is a weaker-signal task: it correlates less tightly with standard demographic variables, and the random forest itself had less training data available. Model performance here was substantially more variable: runs typically fell between the naive baseline and the random forest, but plenty landed outside that band on either side, and no model consistently beat the rest in the reported results, a contrast with the more stable rankings for party identification.
The two tasks produced different model rankings and error patterns. The benchmark did not report confidence calibration, and MAE on ordered response categories does not justify calling a result a coin flip.
"Bisbee et al. ( Bisbee et al., 2024 ) found that even when distributions appear statistically similar, they can lead to substantively different inferential conclusions."
Bisbee and colleagues (2024), cited in Zhao et al., "Large Language Models as Virtual Survey Respondents," arXiv (source)
Why does this matter before a GTM decision ships?
This failure mode is exactly what a human-baseline check is designed to catch before a team acts on it. This benchmark scores individual-level point prediction of a marginal attitude, not recovery of the conditional response distribution or the treatment effects a choice experiment needs; an insights or research lead checking whether an LLM persona's answers are usable for a specific question is at most checking how demographically predictable that question is, and an ungrounded model roleplay does not surface that on its own.
For a descriptive question, compare simulated responses with a matched human survey. For a randomized intervention, preserve the treatment and choice endpoint in a human agreement test. Moving between those endpoints changes the research question.
What this study does not establish
None of the specific accuracy figures, model rankings, or benchmark results in this study are Subconscious findings, and Subconscious did not run or endorse this experiment. A separate industry review of synthetic survey samples has also documented significant limitations in AI-generated responses relative to real respondent panels (Verian Group, "Synthetic Sample in Social Research"). The lesson to take from both is procedural, not a number to reuse: test the demographic predictability of the question before trusting a model's answer to it, and check a weak-signal result against a real human baseline before it drives a decision.
Next step
Compare methods for testing a causal marketing question, including where a real-human baseline changes the answer, at Subconscious's research and leaderboard pages, or see how the validation workflow runs end to end.