Seven Survey Biases That Distort Market Research Numbers
A consumer insights lead is about to greenlight a launch, a price, or a message on a survey number: does it describe what the market will actually do, or how the market wanted to answer a question?
Survey bias is systematic error relative to the intended quantity. Identify plausible sources before a number informs the launch; no universal count establishes how many biases affect a particular survey.
Seven biases and illustrative examples
The numerical examples below are invented teaching scenarios, not measured market results. A discrepancy may have several explanations; the comparison alone does not identify the named bias.
| Bias | What happens | Example |
|---|---|---|
| Social desirability | Respondents answer to look good, not to report their real behavior | A sustainability survey finds 68% say they "always or usually" choose eco-friendly products; actual market share for those products in the same demographic is 12% |
| Acquiescence ("yea-saying") | Respondents default to agreement regardless of the statement | 78% agree a feature is useful, and 74% also agree with the reverse-coded statement that the feature is not useful, revealing acquiescence rather than a stable opinion |
| Framing effect | Question wording changes the answer even when the underlying fact is identical | A policy framed as "saves 200 of 600 jobs" draws more support than the same policy framed as "400 of 600 jobs lost" |
| Recency bias | Recent experience gets overweighted relative to the general pattern | Satisfaction scores drop 30 points after a two-hour outage, even though the disruption was brief |
| Sampling bias | The people who receive the survey do not represent the target market | A 15% response panel skews toward frequent buyers by design; churned, dissatisfied customers were never included in the sample frame, and the resulting 4.3/5 satisfaction score is not representative |
| Non-response bias | Non-responders differ systematically from responders | Respondents score satisfaction 1.6 points higher than a follow-up census of the 92% who stayed silent, most of them casual and frustrated users who are already leaving, so the 8% response rate is biased despite being small |
| Recall bias | Respondents misremember past behavior | Consumers report visiting a competitor's site an average of 2.3 times last month; the same demographic's logged analytics show 7.8 visits |
For a decision, investigate the measurement and sampling mechanism rather than assuming the example’s explanation applies.
What a defined experimental population does and does not resolve
A controlled study defines an audience and task. That makes scope explicit but does not automatically remove coverage or selection bias:
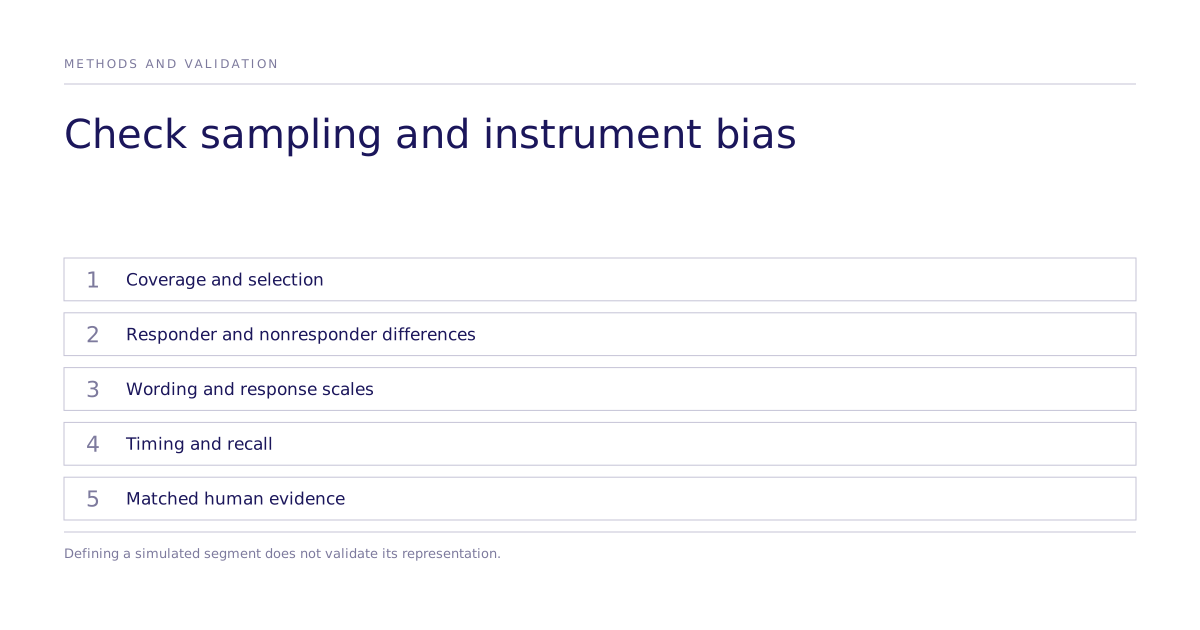
- Sampling bias: a synthetic population depends on its persona construction, training information, weighting, and modeled segments. Defined segments need validation against the target population.
- Non-response bias: synthetic generation does not involve human refusal, but modeled responses can omit poorly represented groups or fail to reproduce differences among human responders and nonresponders.
It does not structurally remove the other five. Social desirability, acquiescence, framing, recency, and recall bias are instrument-design problems: they call for balanced scales instead of agree/disagree statements, multiple question frames tested against each other, and timing controls that separate a transient event from the general pattern. Social-desirability bias in particular is a property of how a respondent answers under observation, not of who is asked, so precise sampling alone does not touch it.
What a matched human check establishes
A matched human study tests agreement for its specific population, instrument, and endpoint and can fail. Inspect effect magnitude, distributions, and uncertainty separately. Agreement on parameter ranks does not establish that every bias disappears or that a new market will reproduce the result.
Choose an optional simulated screen, direct human research or live testing from the objective, existing evidence and cost of error. If the decision relies on a simulated result, specify a matched human population, treatment and endpoint, and confirm recruitment and fieldwork ownership in the study brief. Changing the endpoint requires a separate validation design.
Before the number goes in the deck
Treat any survey-derived number consistently: name which of the seven biases could be operating, decide whether the instrument was designed to control for it, and decide whether the decision is big enough to warrant a controlled check against a human baseline before budget moves. Case studies and the research methodology behind this approach are worth reading before that decision.